A normal report
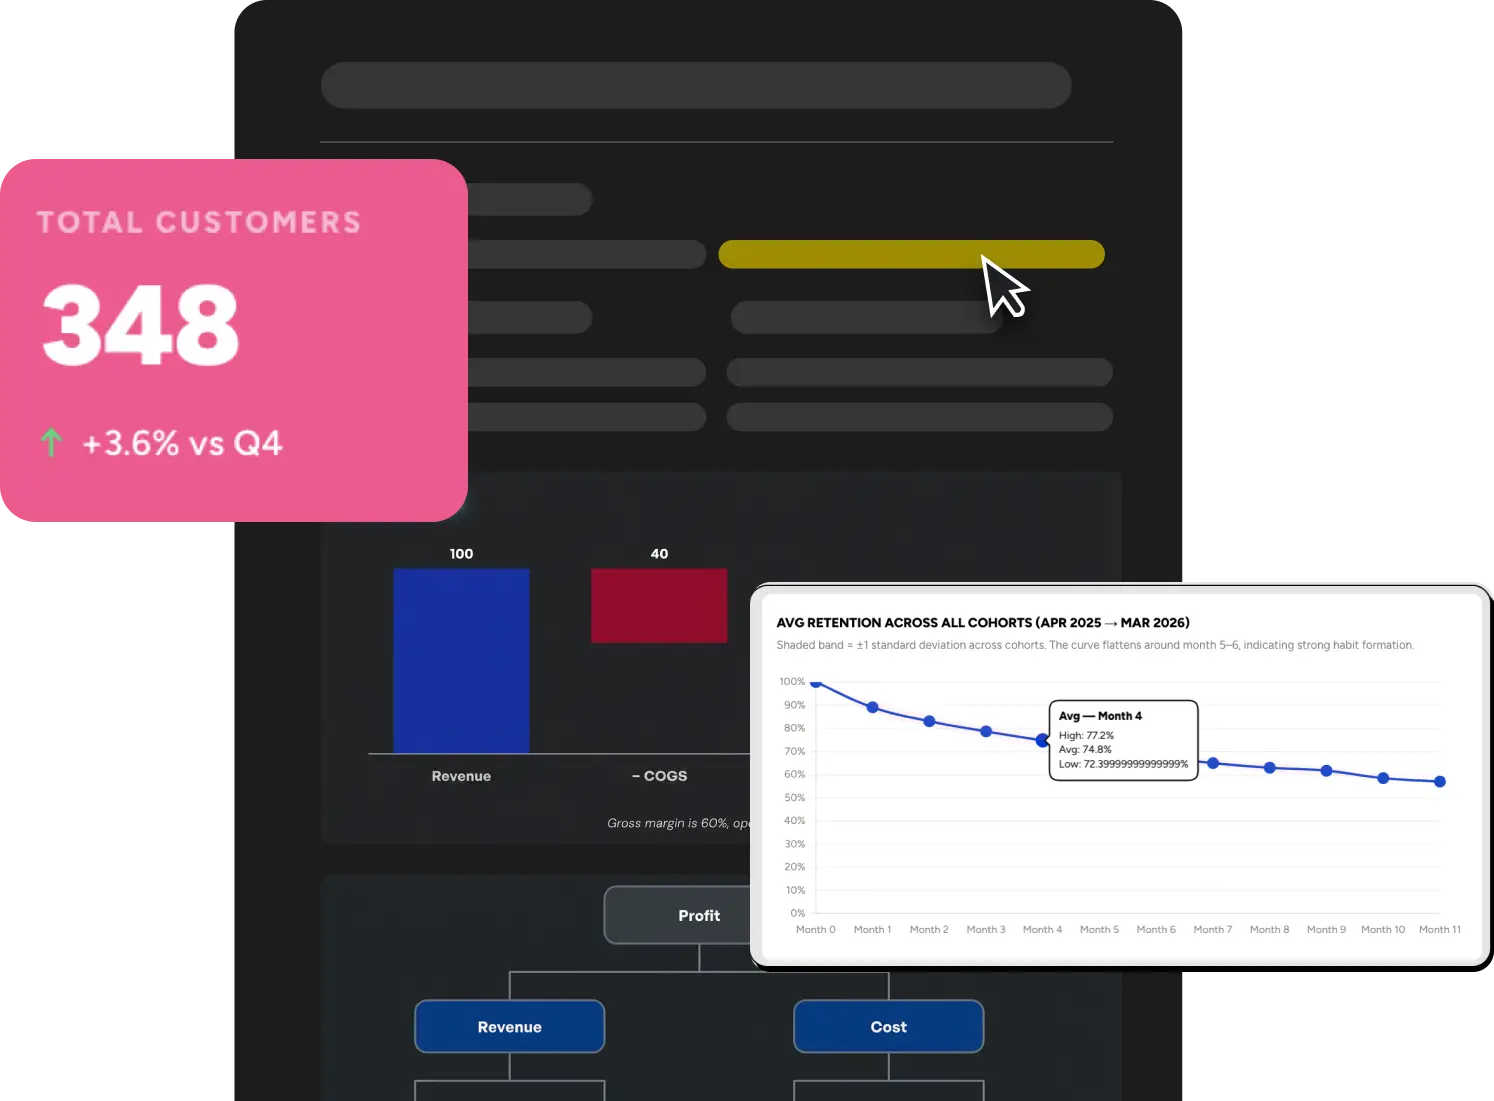
- Static charts + tables
- One view for everyone
- Reader mostly scrolls/skims
- Trust is assumed ("take our word")
- Updates = re-export + resend


Processes visuals
60,000x
Faster than text
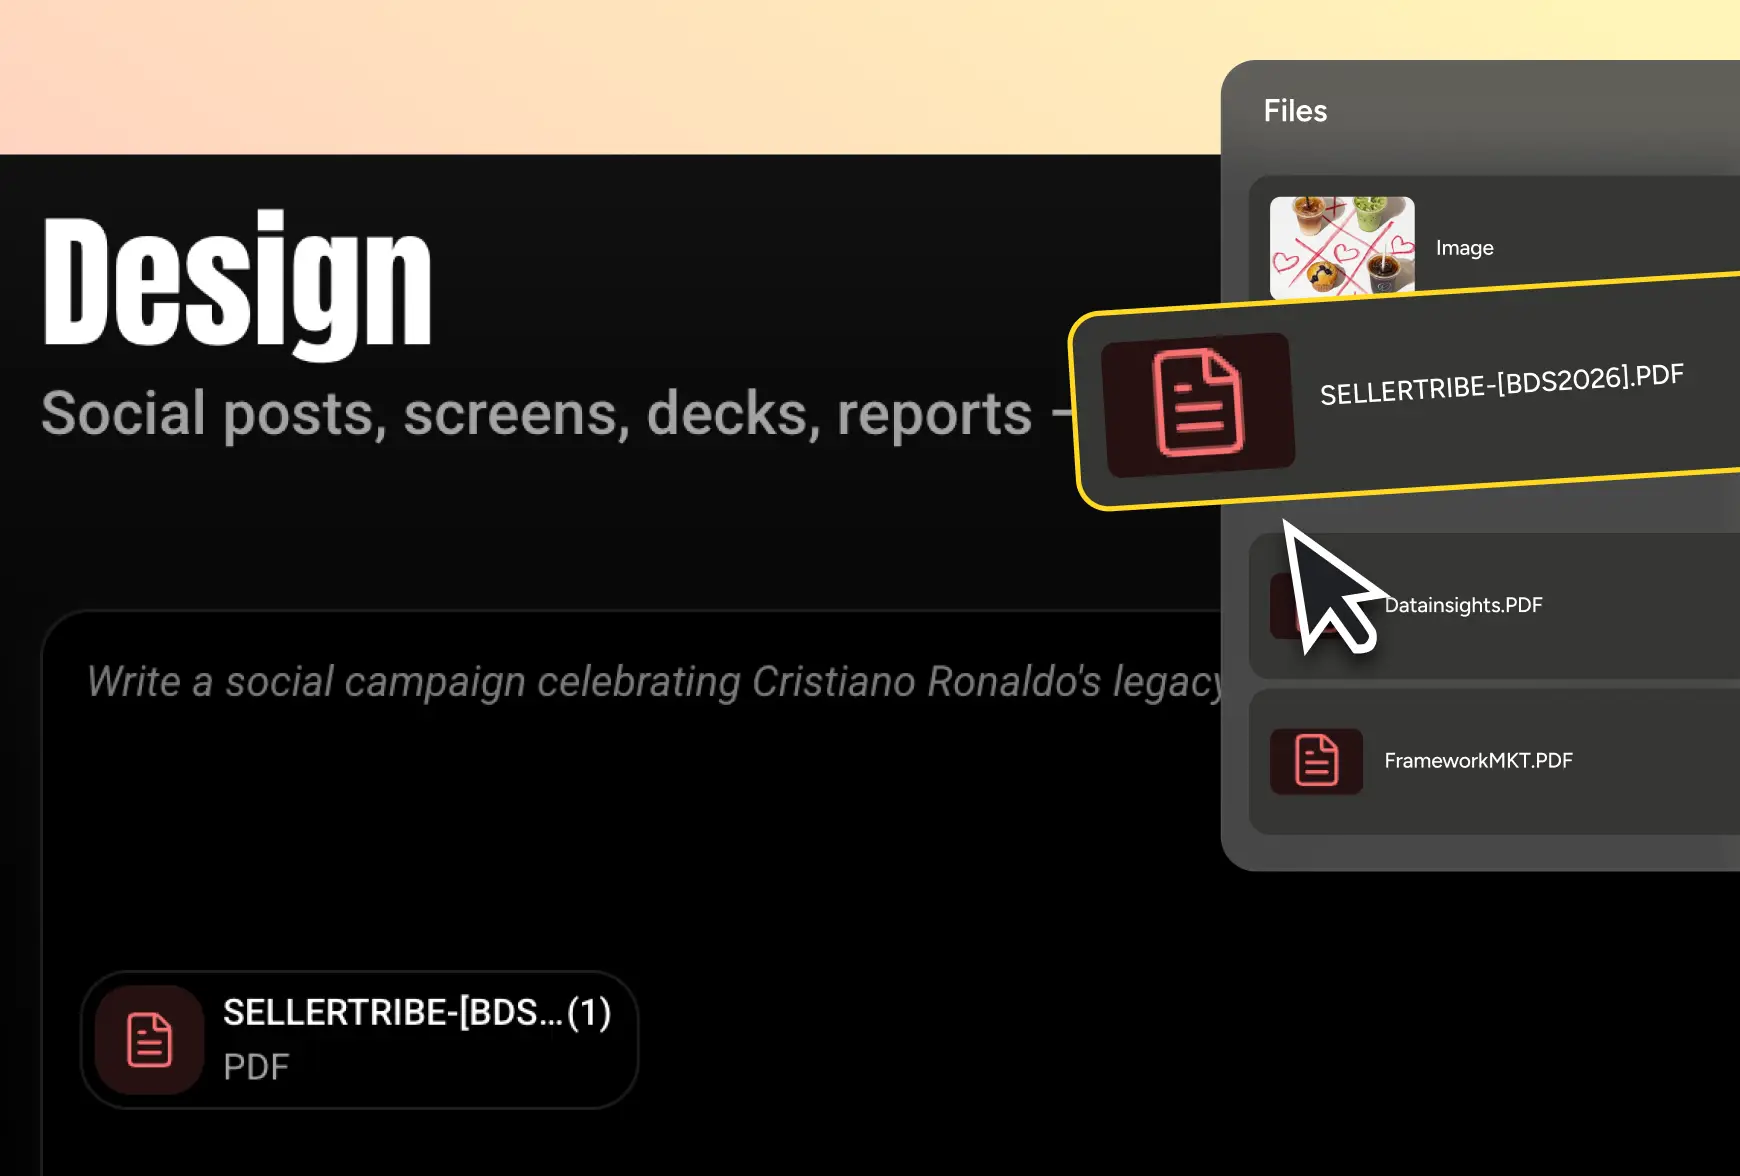
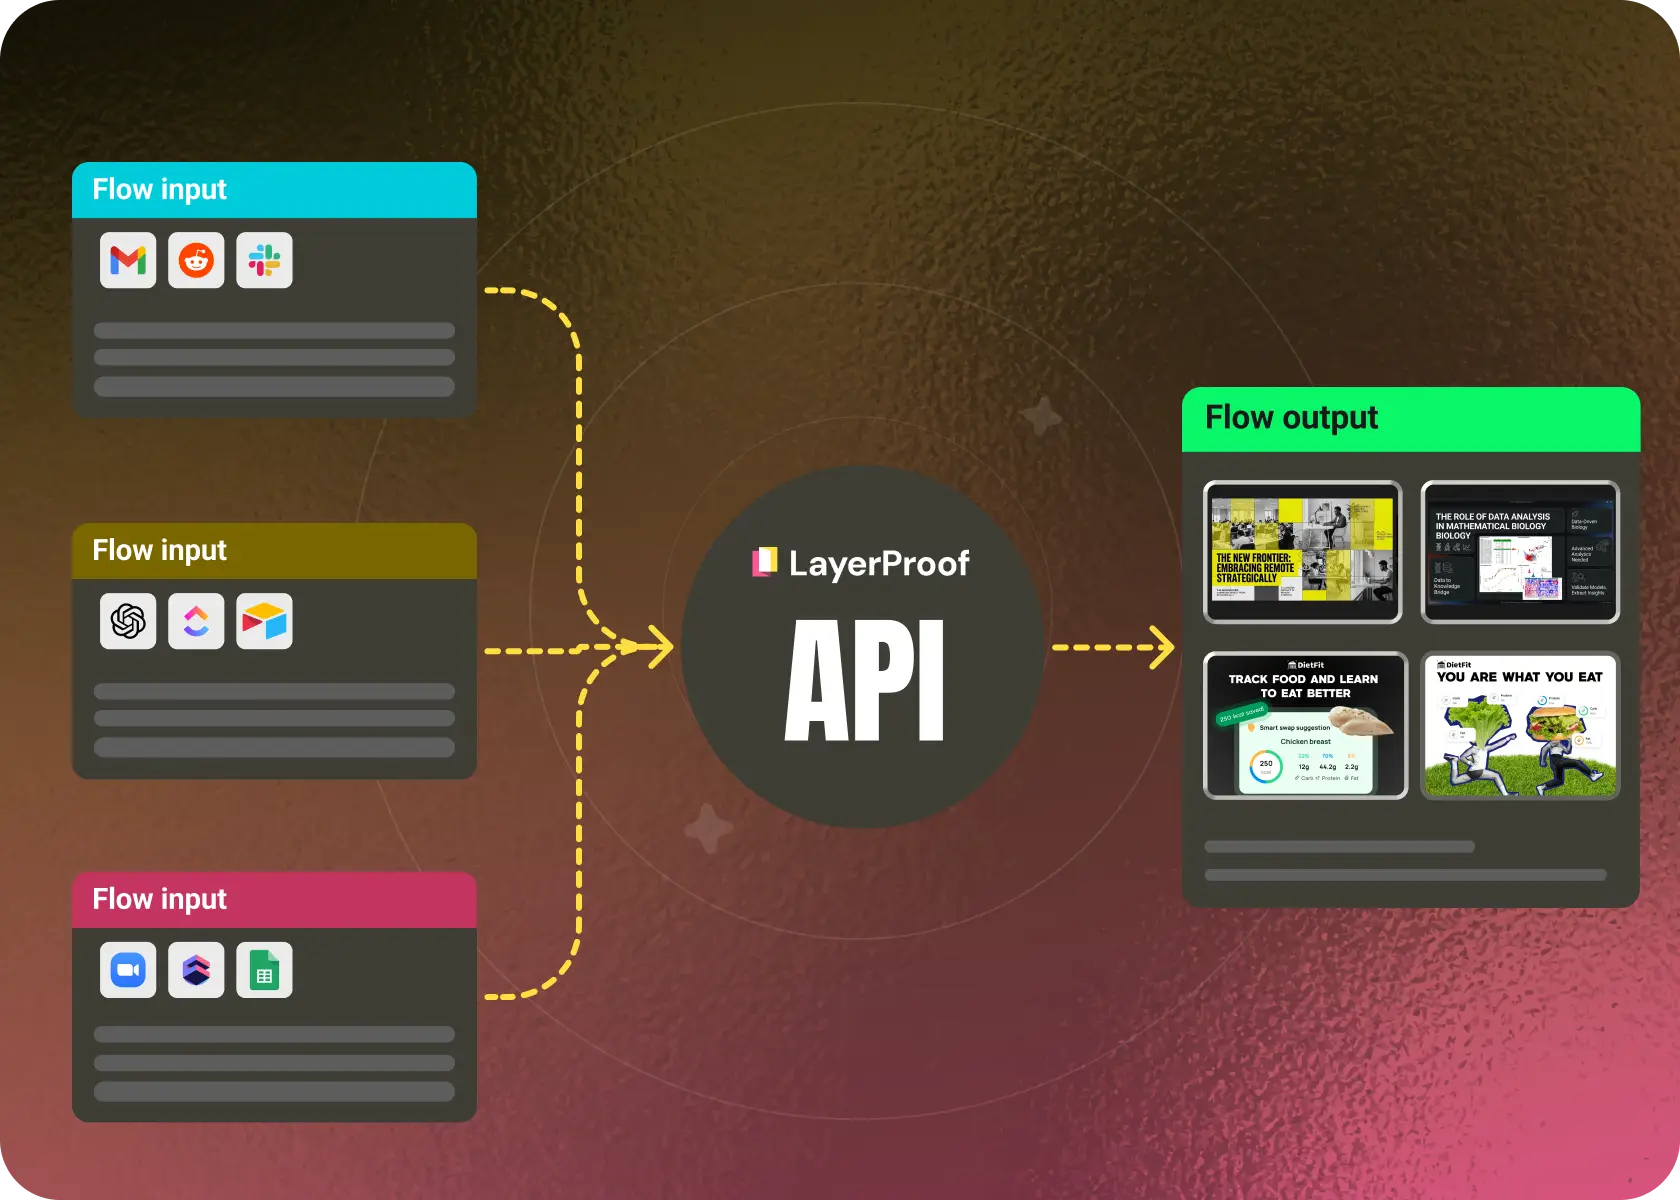
Files, URLs, pasted information. Just drop in what you want to visualize.
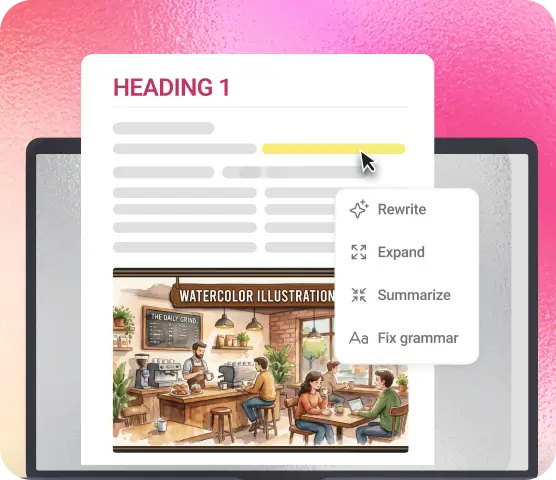
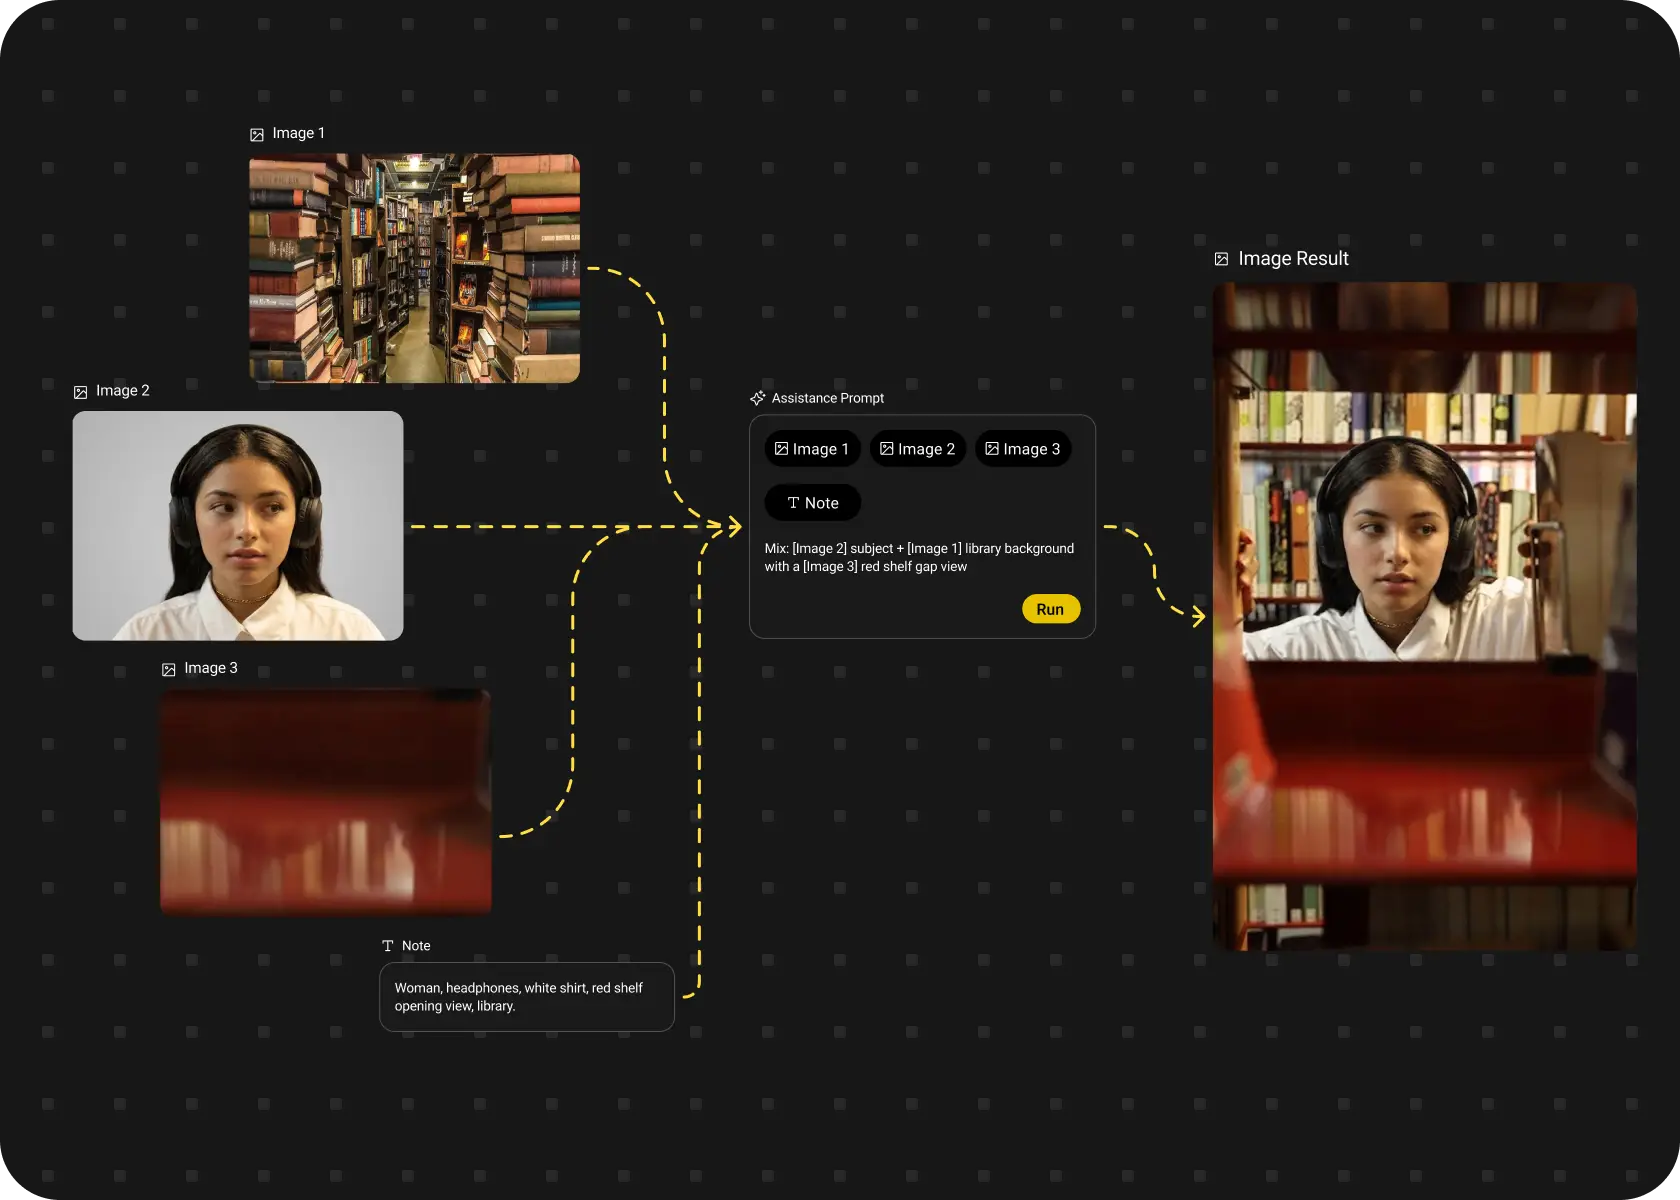
Adjust charts, change tone, swap angles. Make it interactive without skills needed.
Adjust charts, change tone, make it interactive.
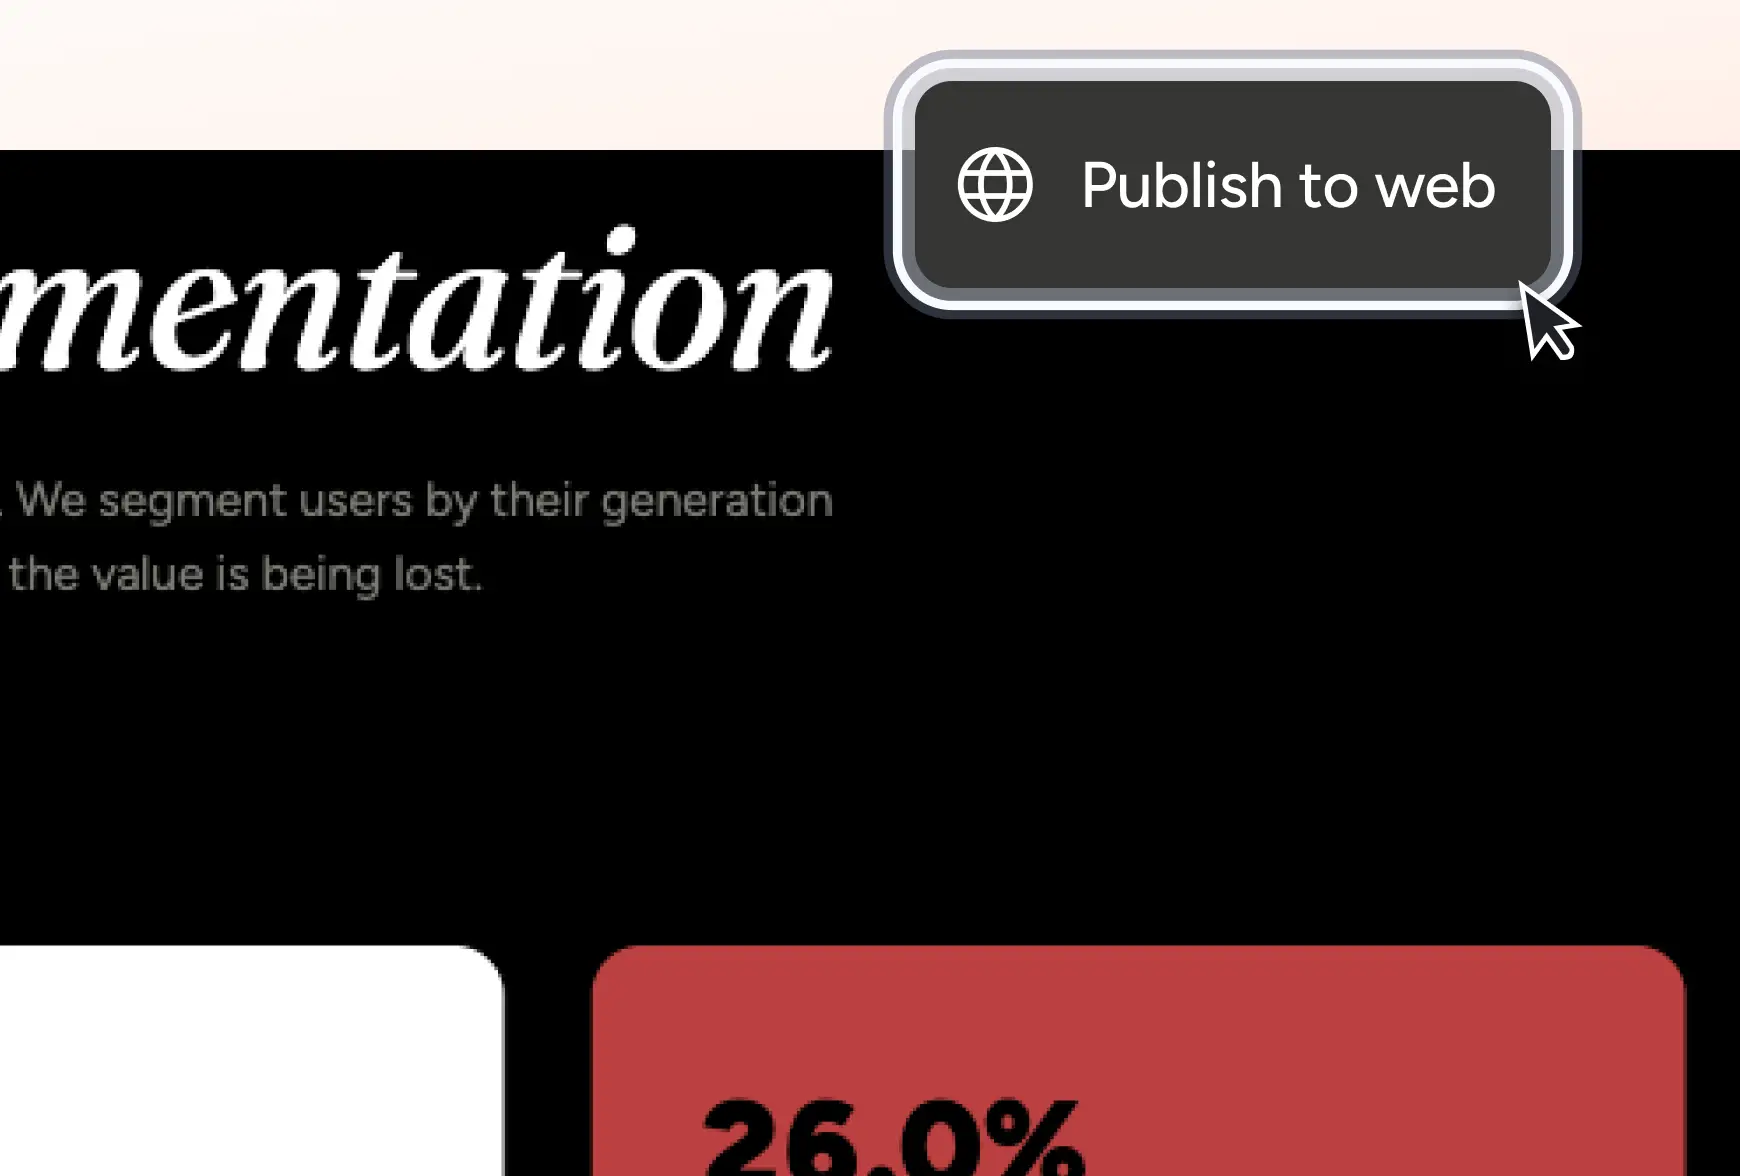
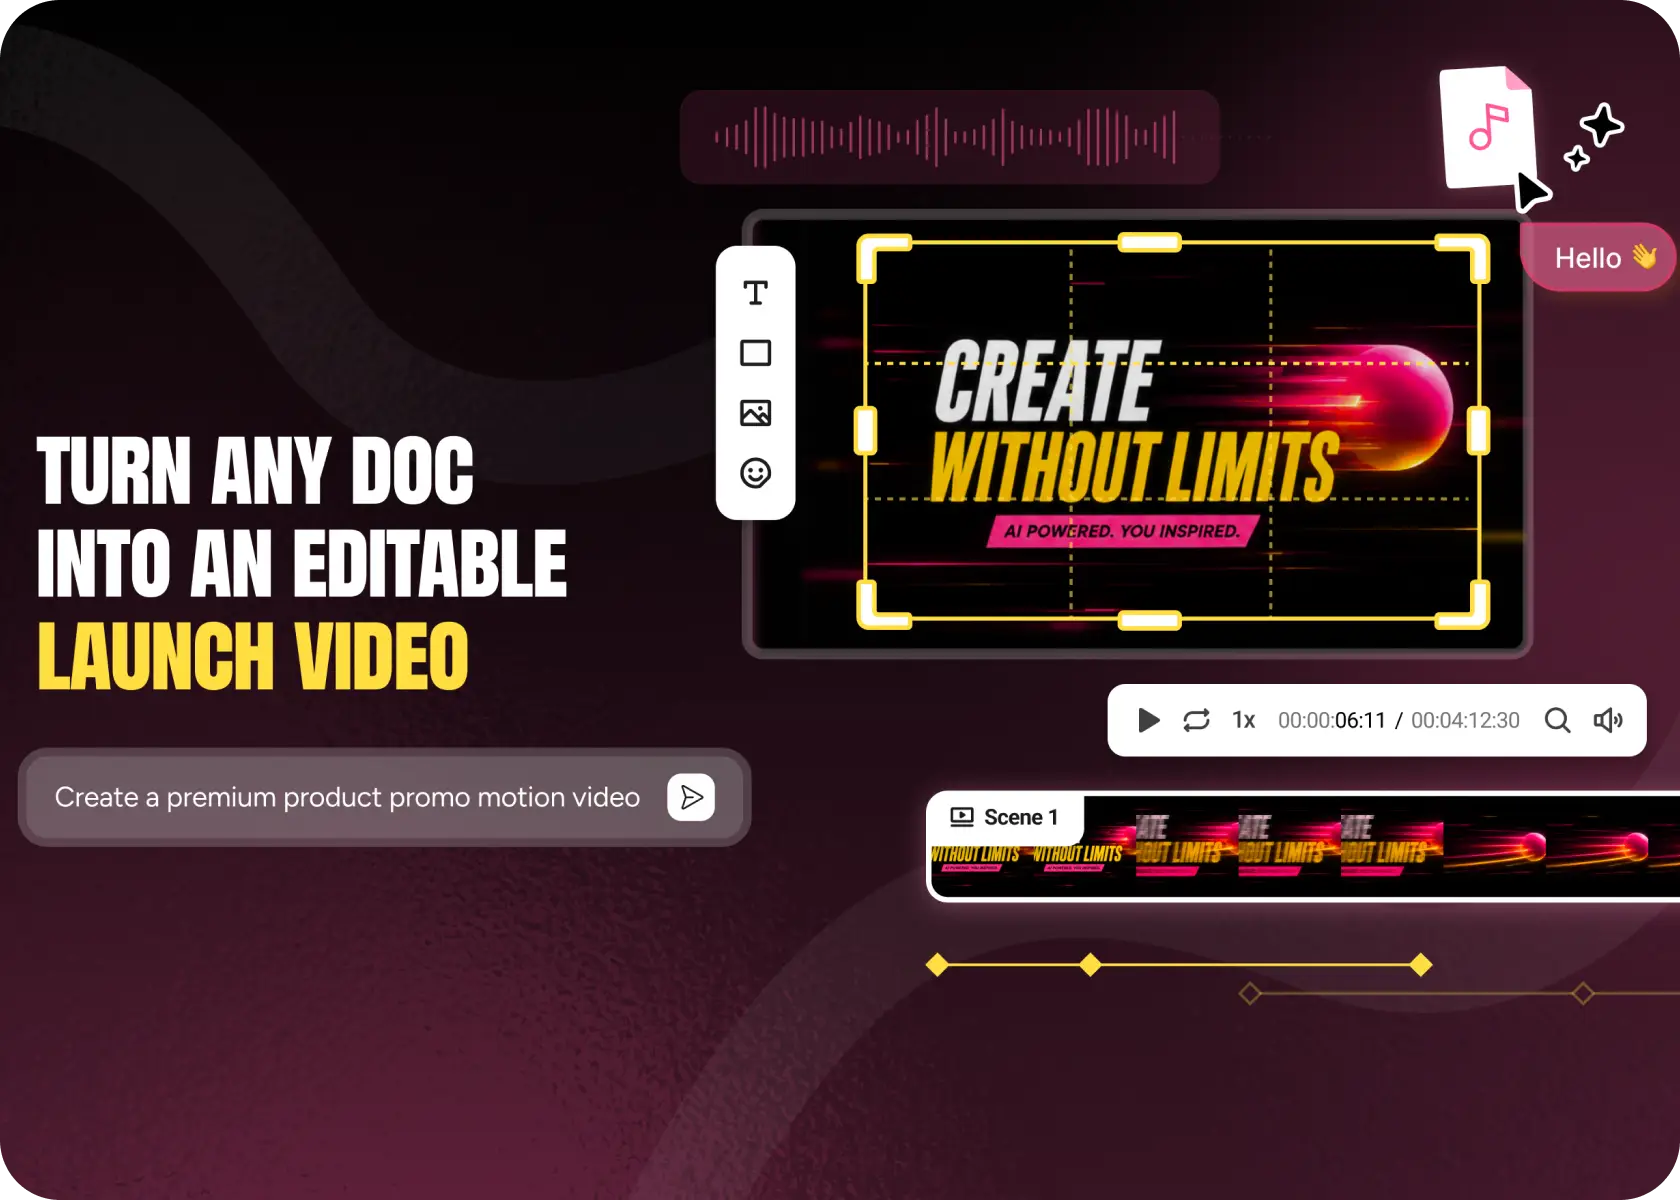
One click. And it is live to your audiences.
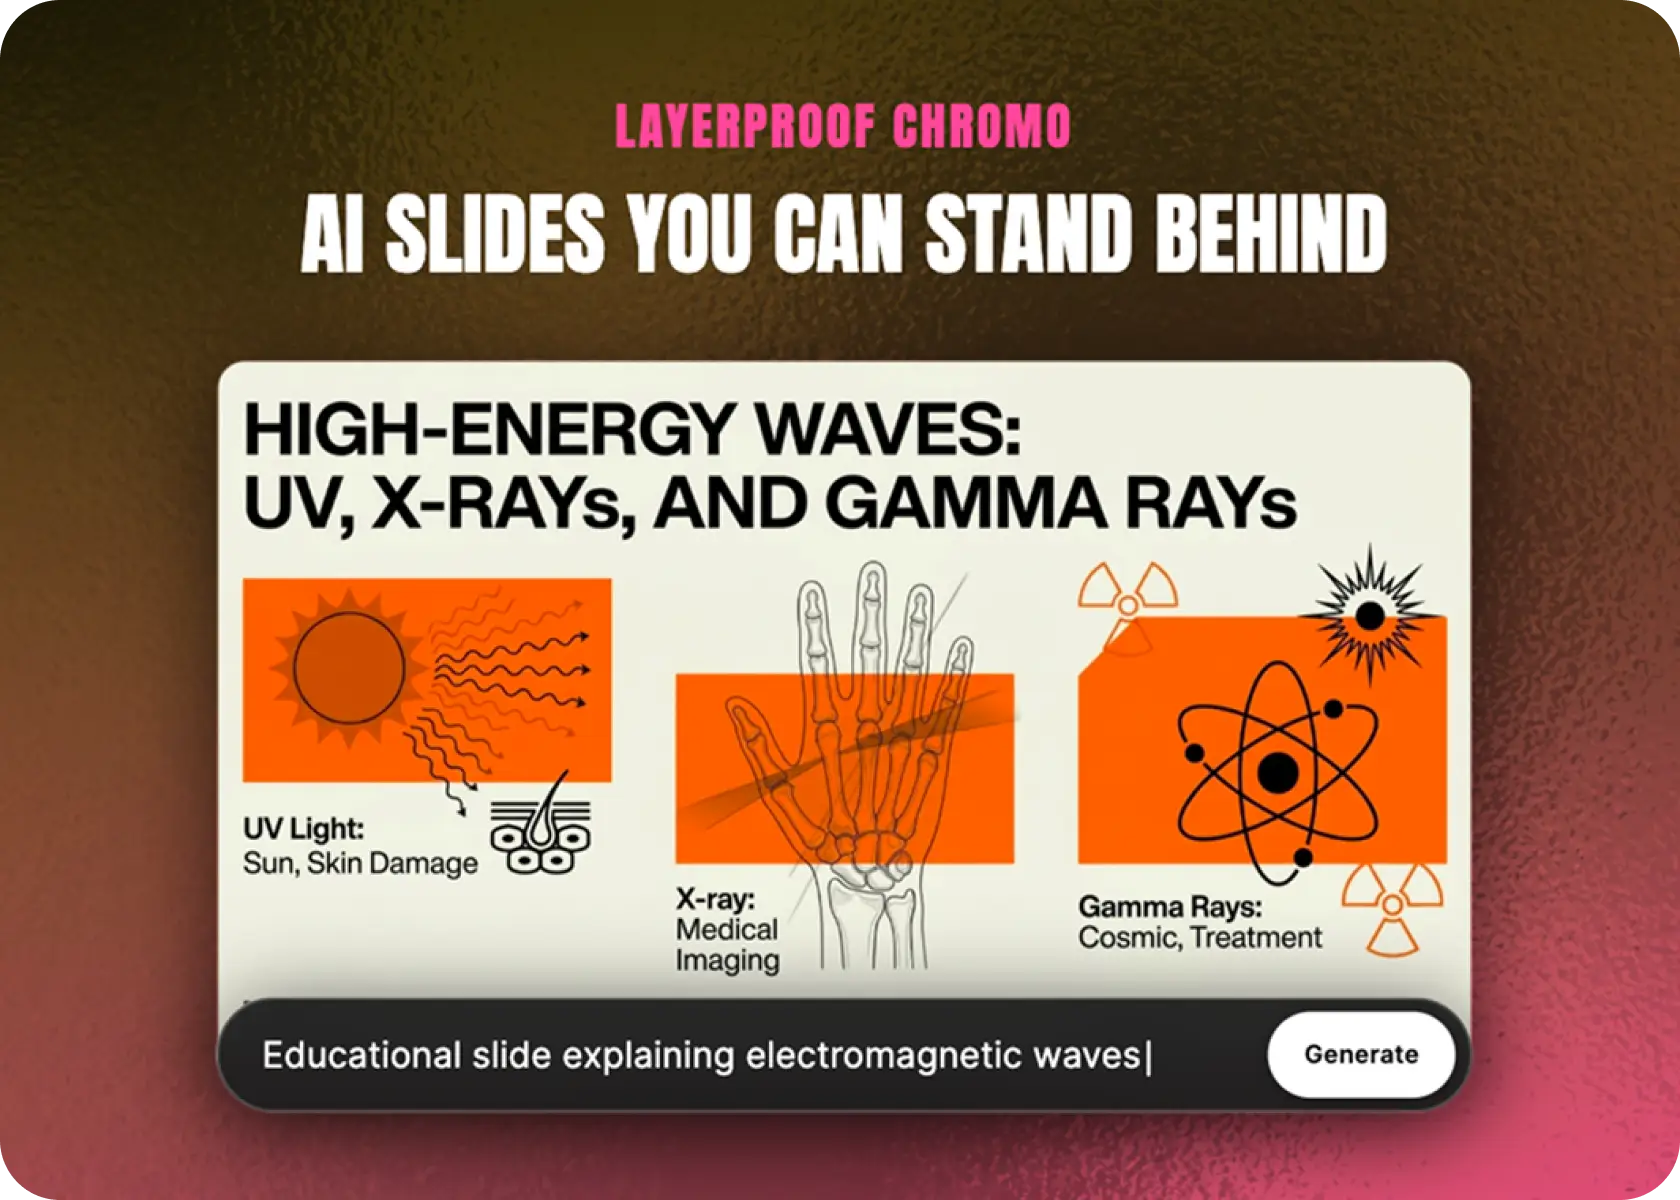
Bristol turns what you ask into real ready-to-use HTML. Not templates.
Start now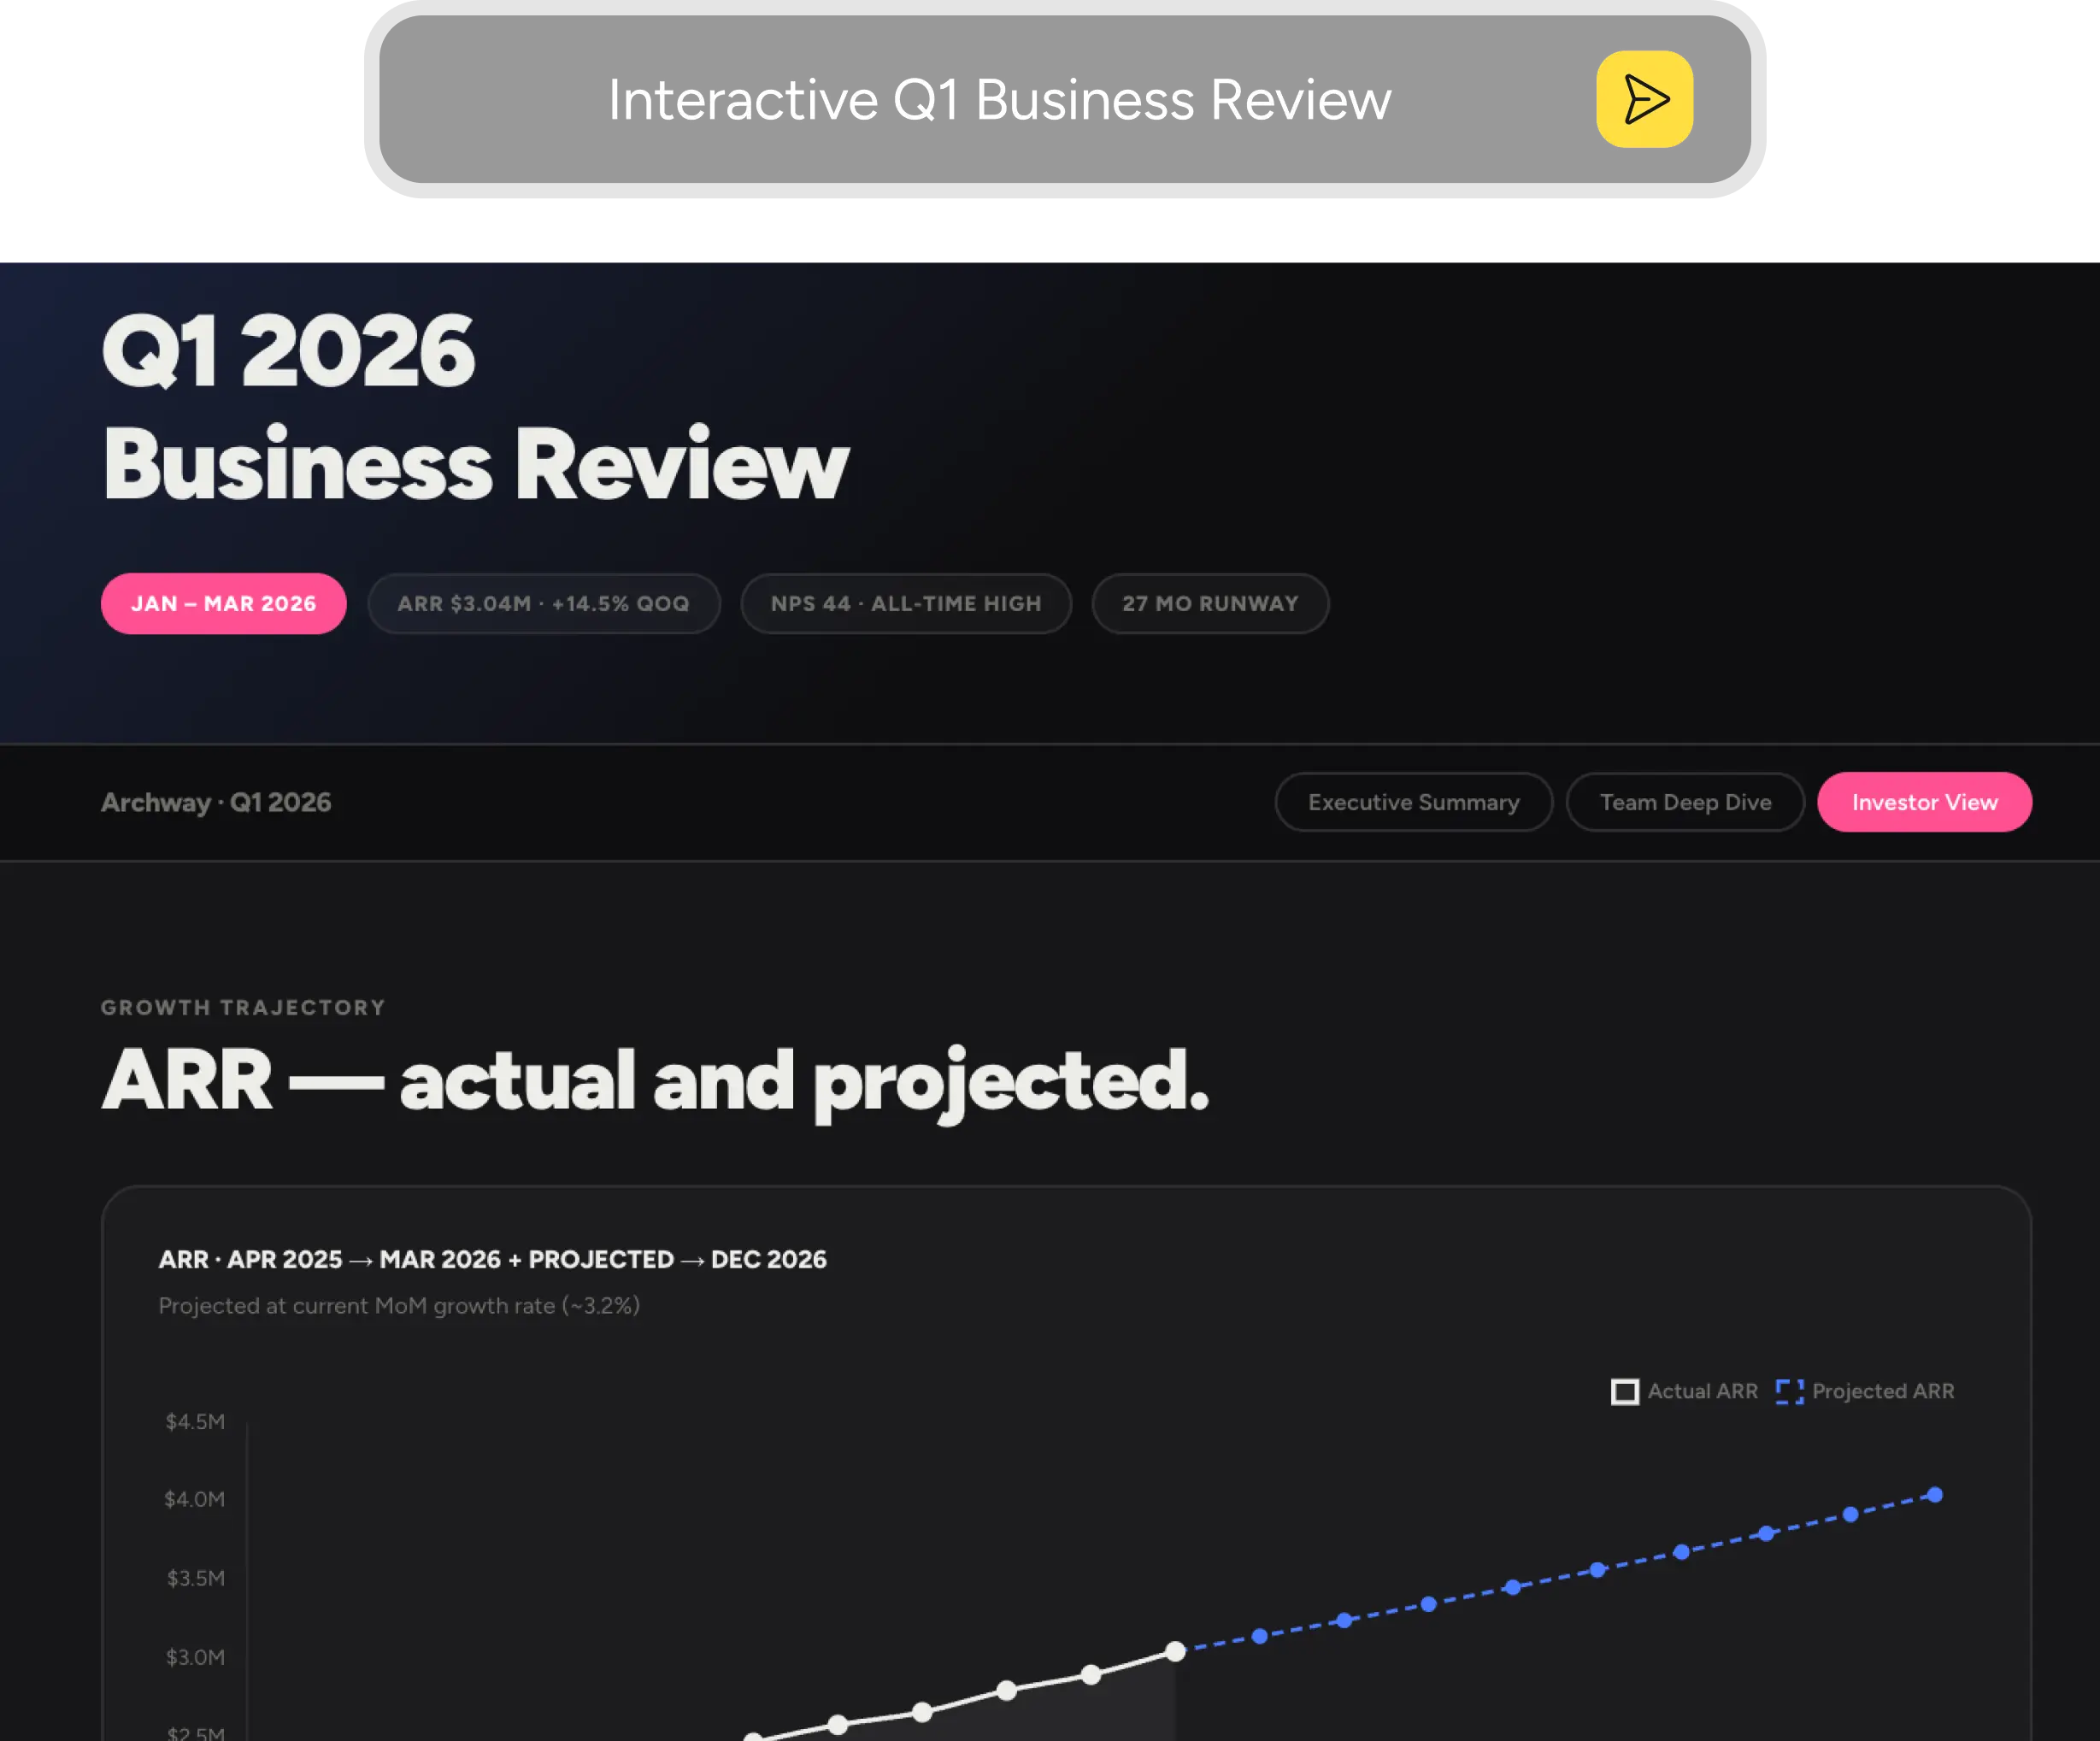
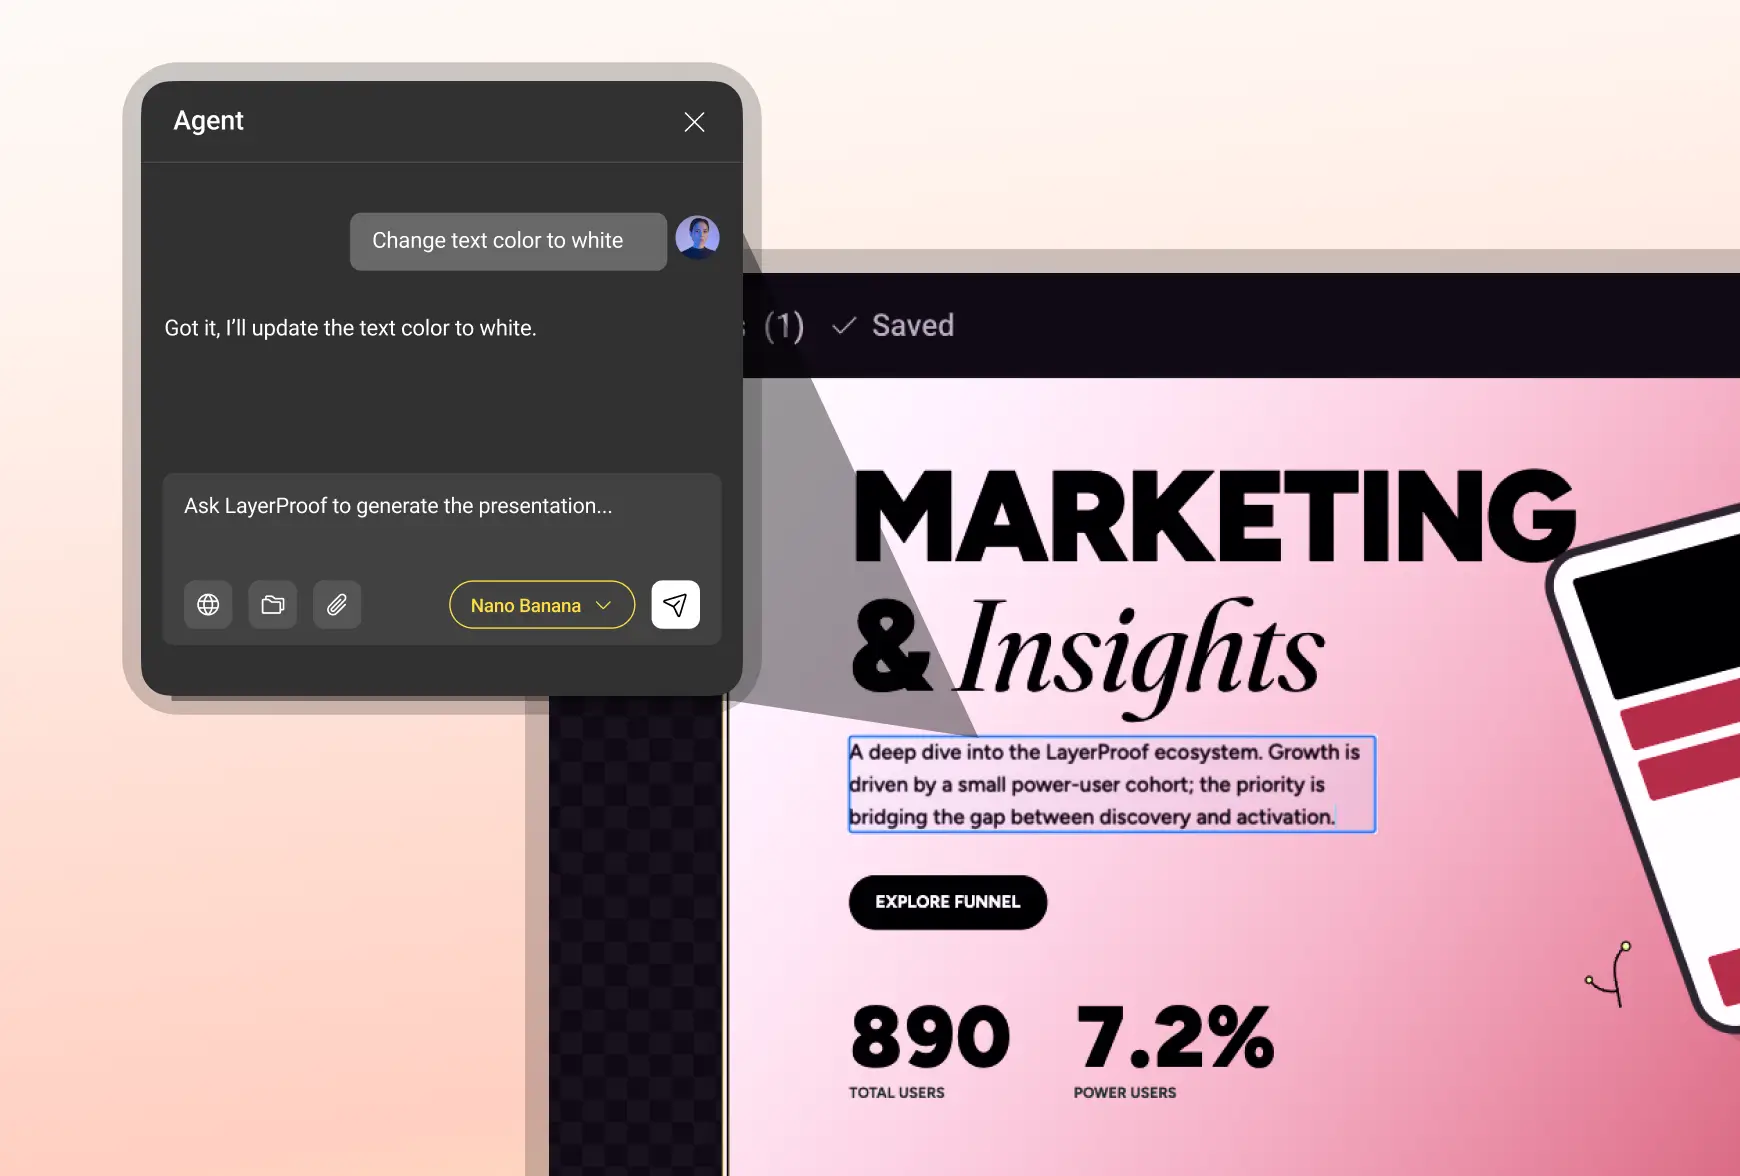
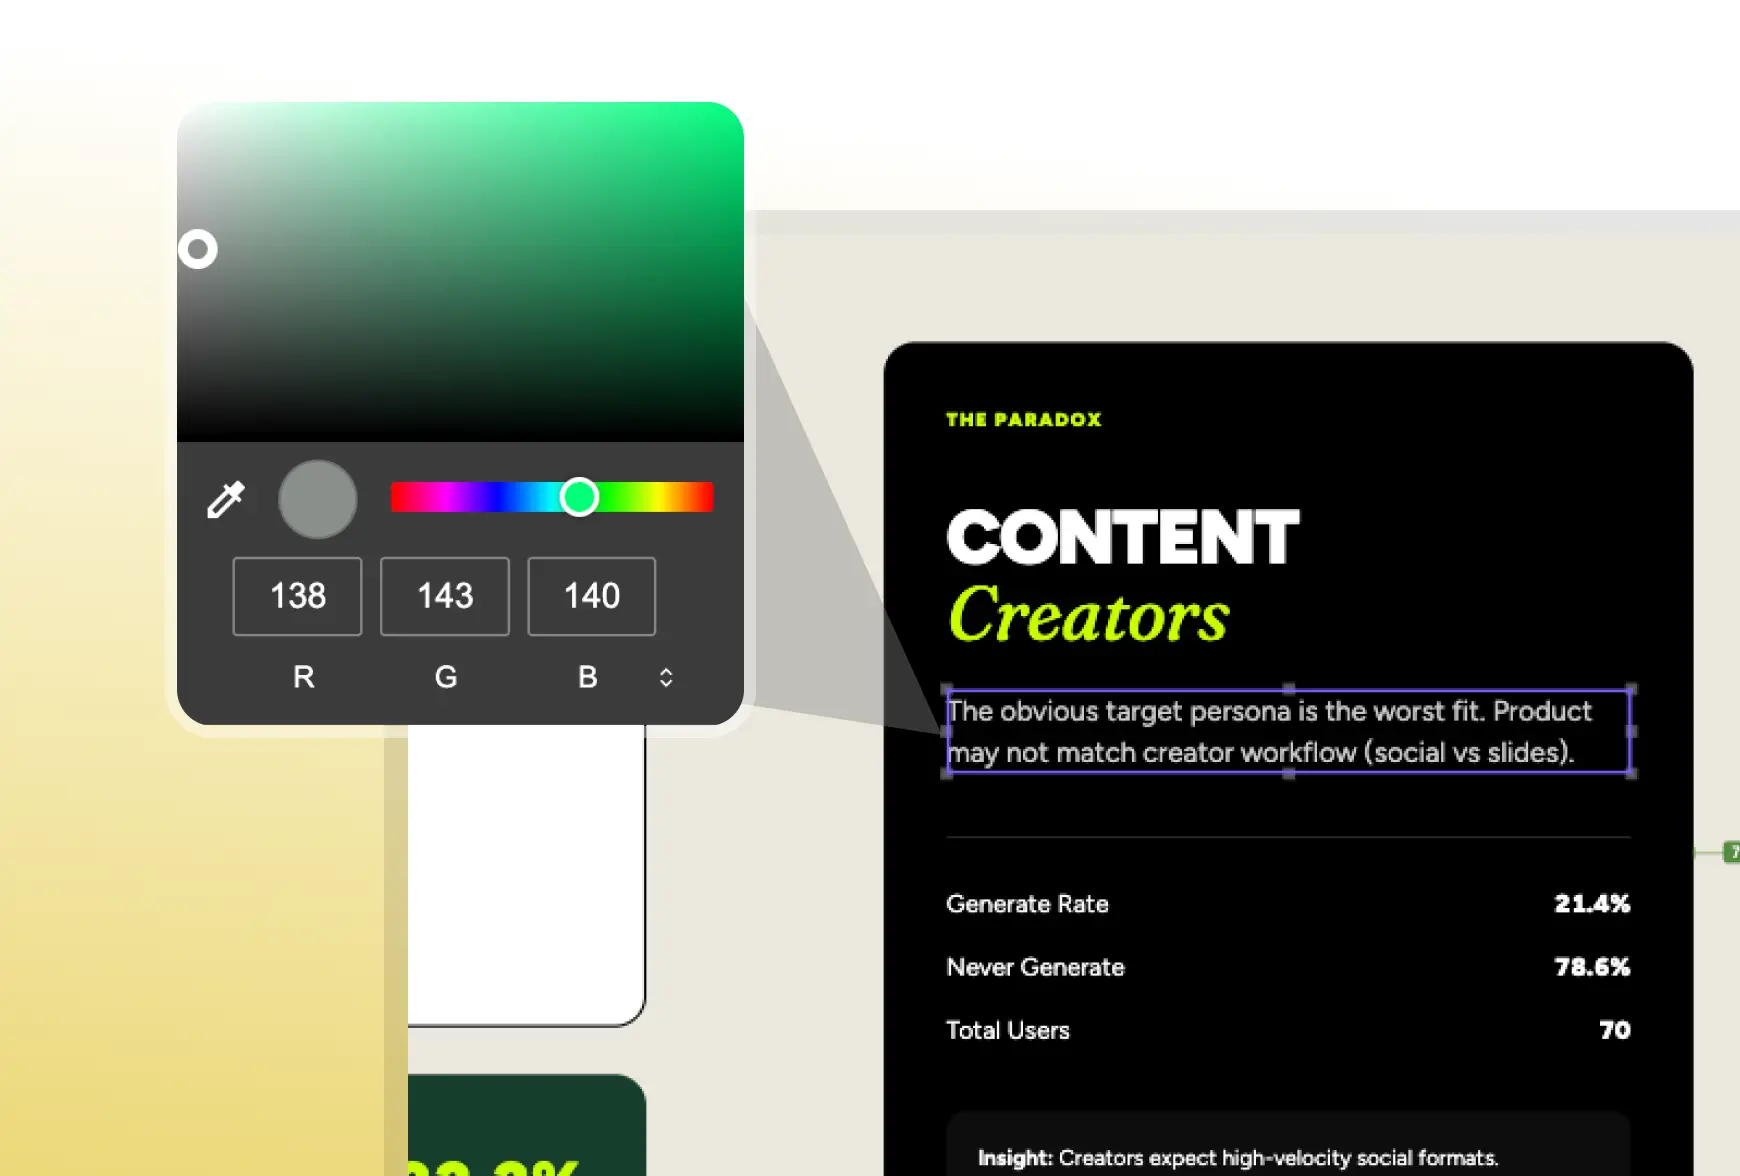
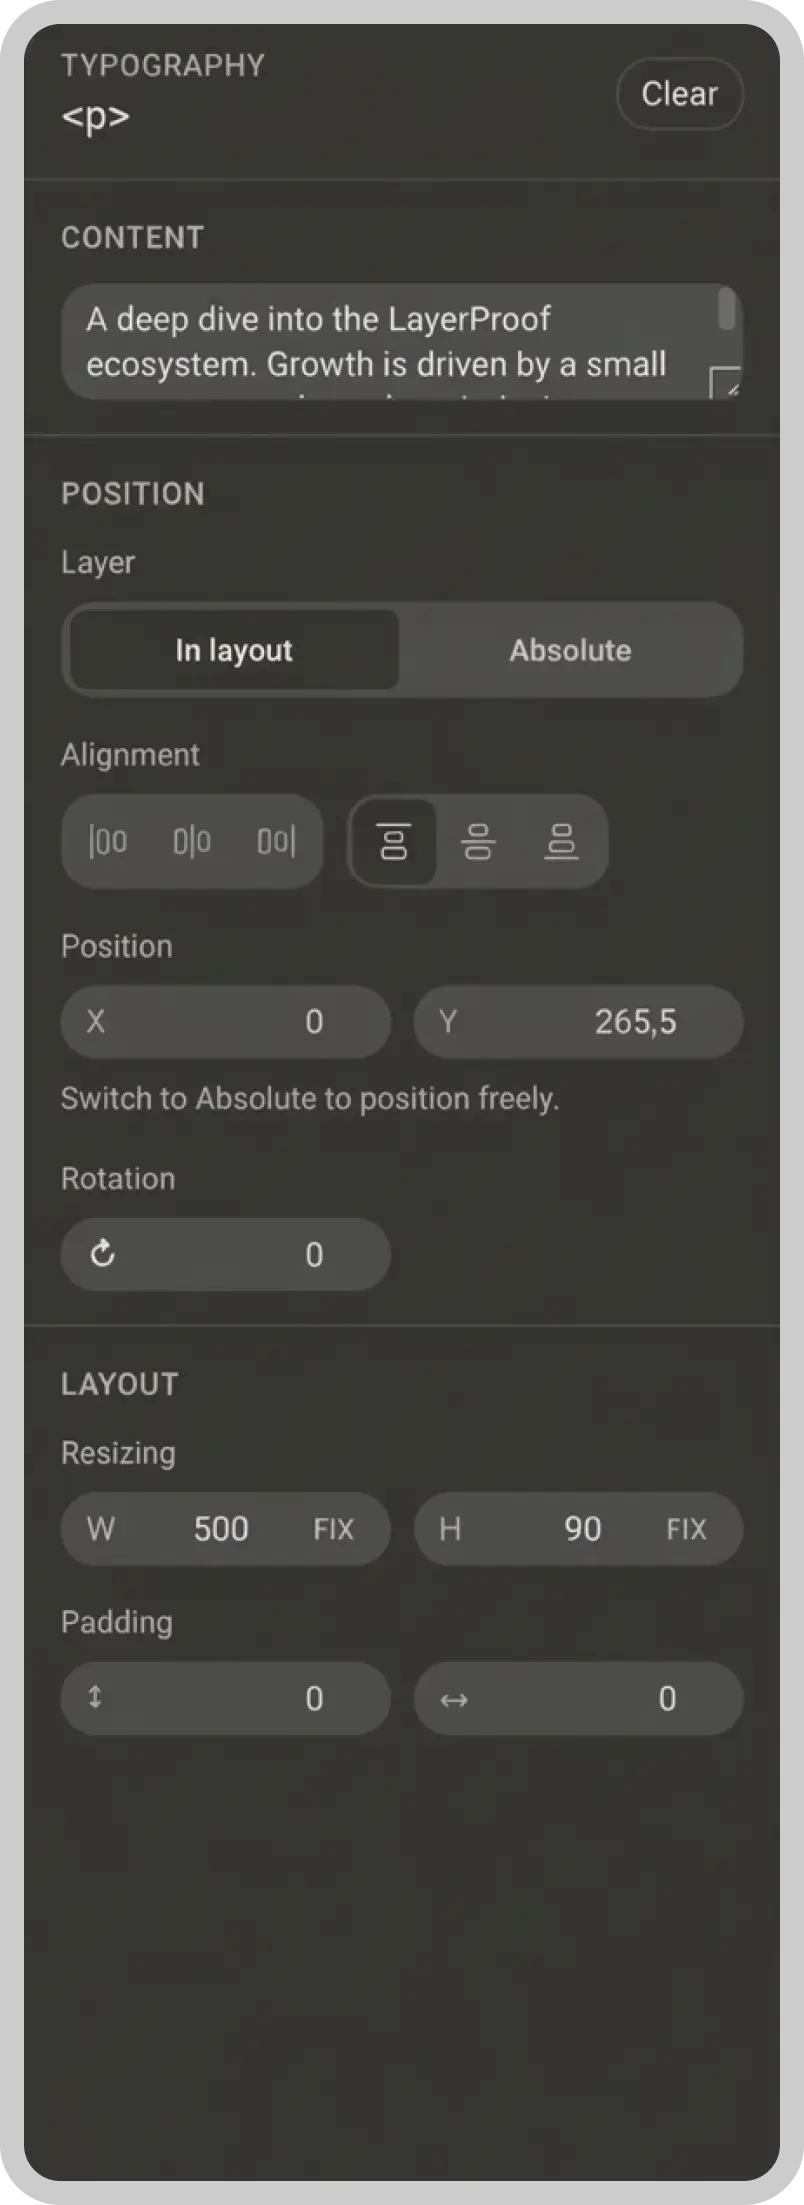
Click directly into text, charts, or layout. Or just type what you want changed.
Start now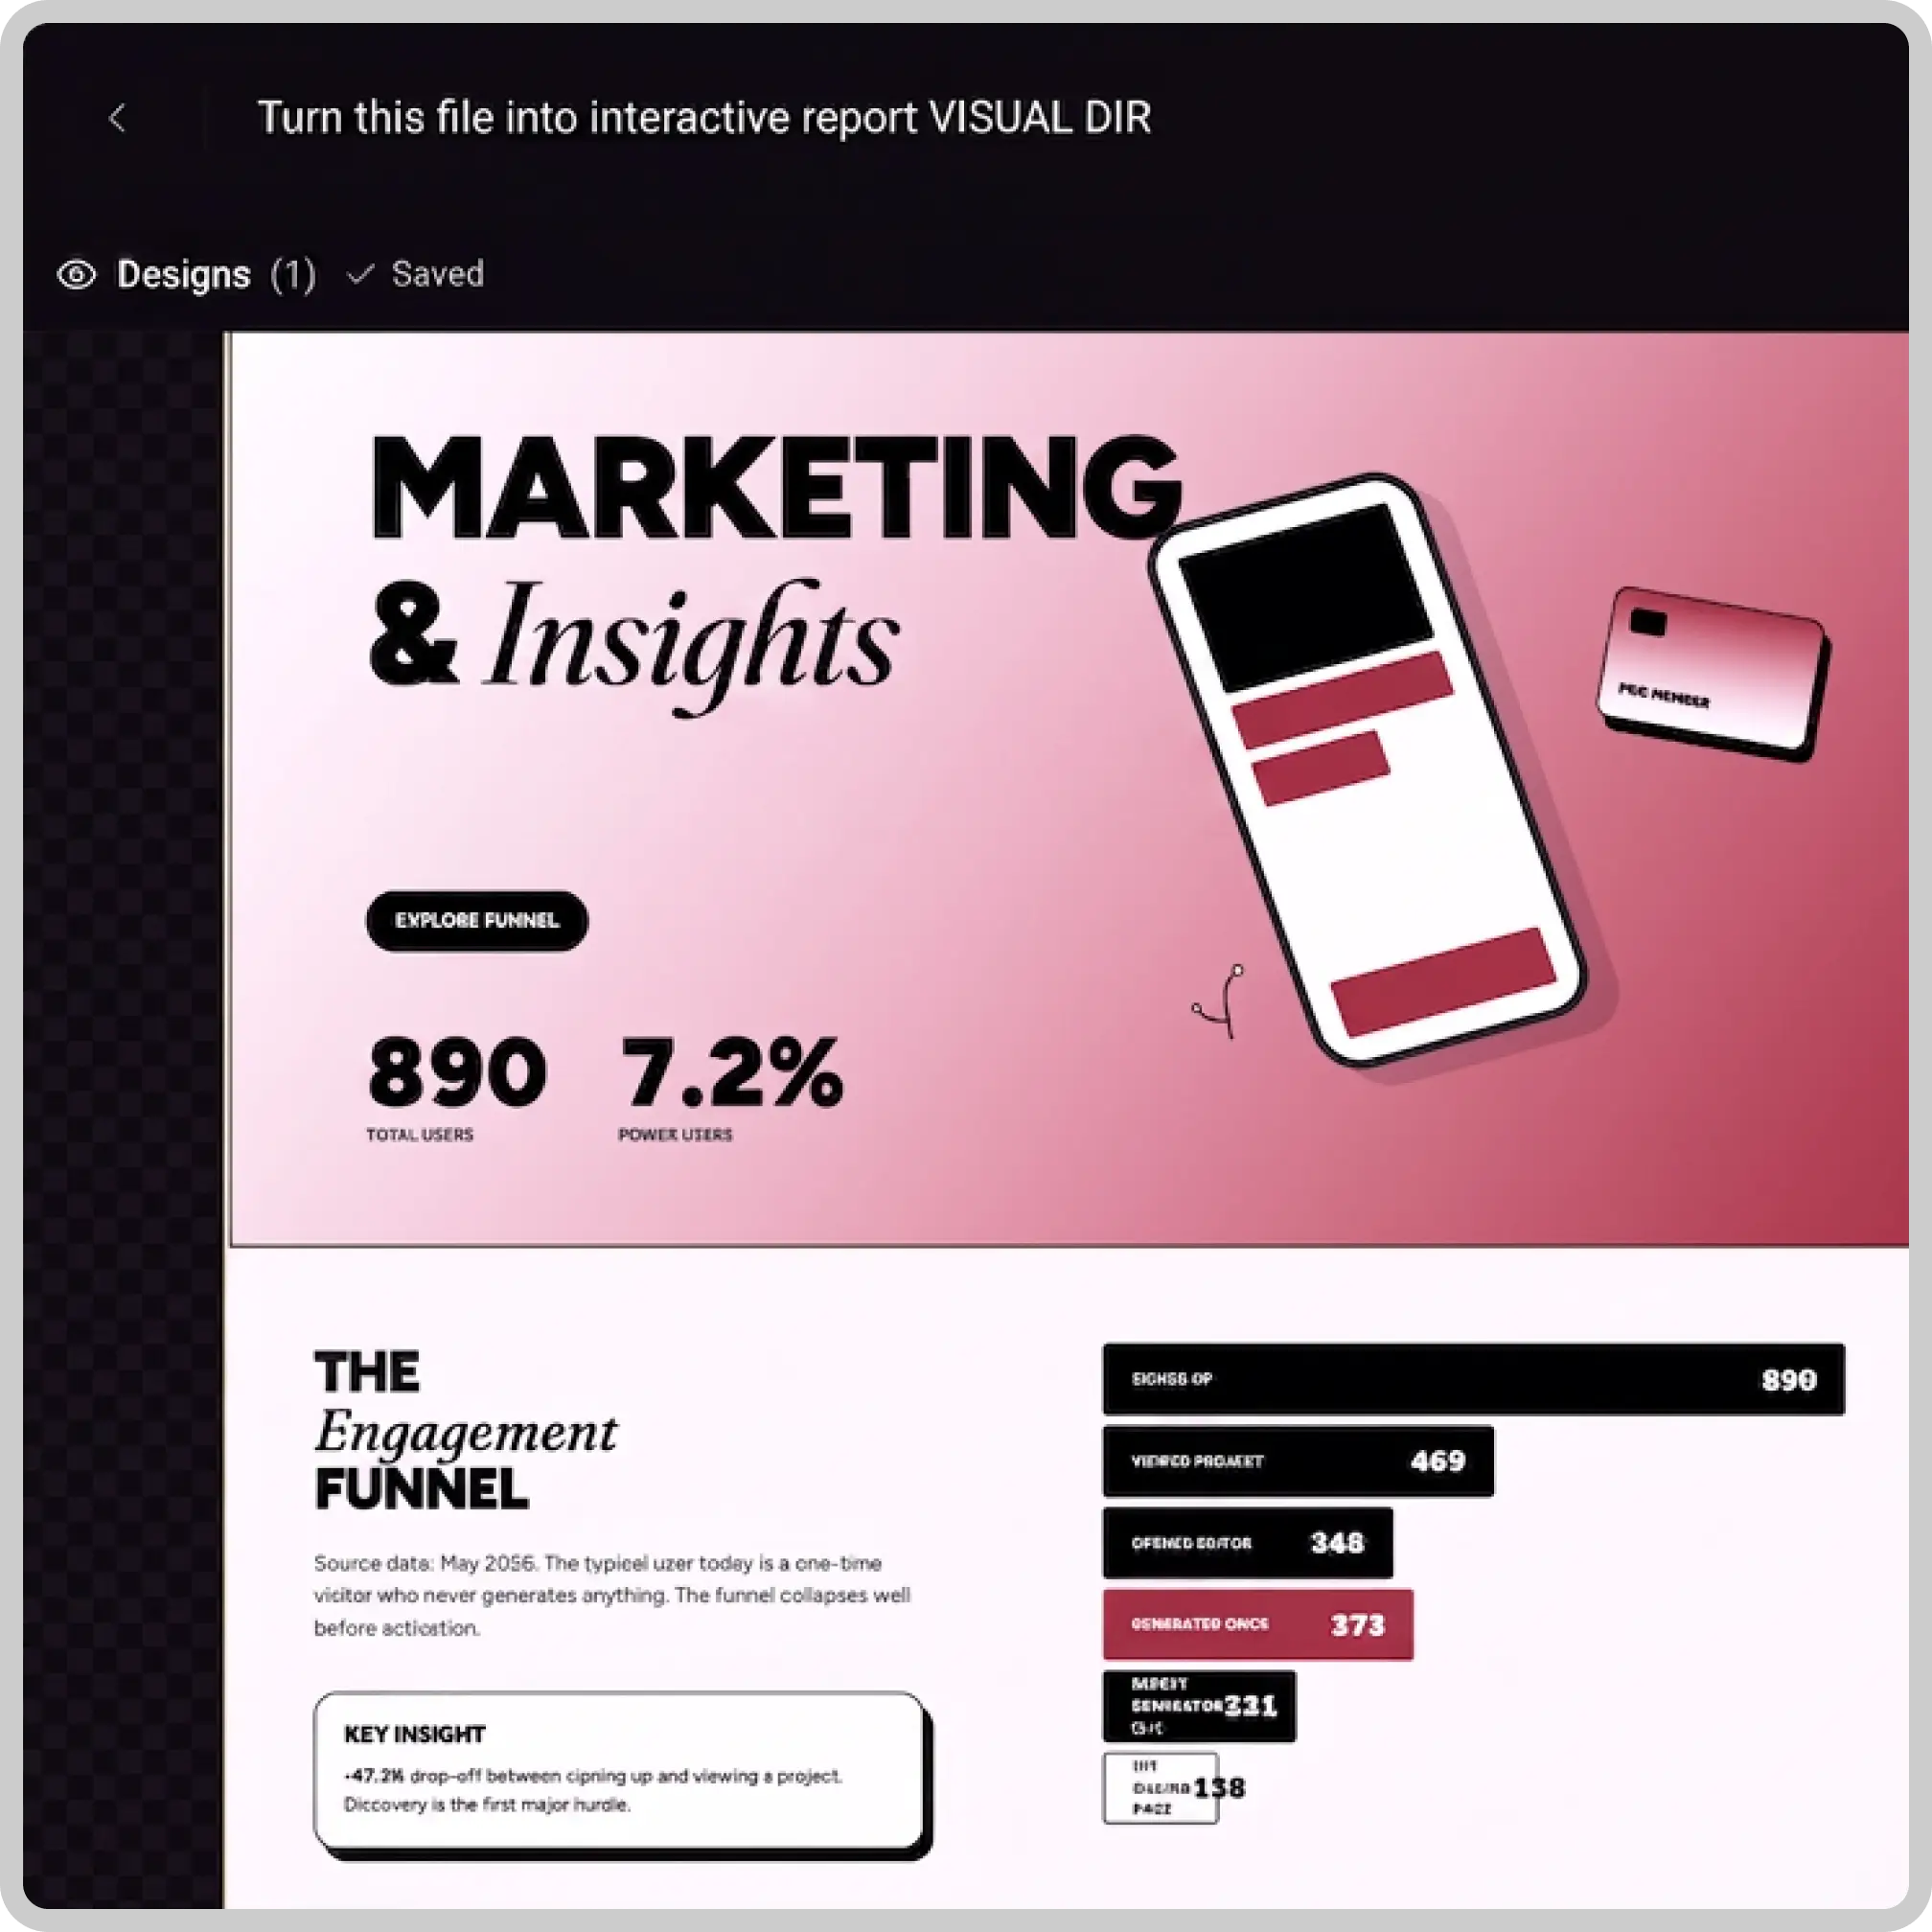
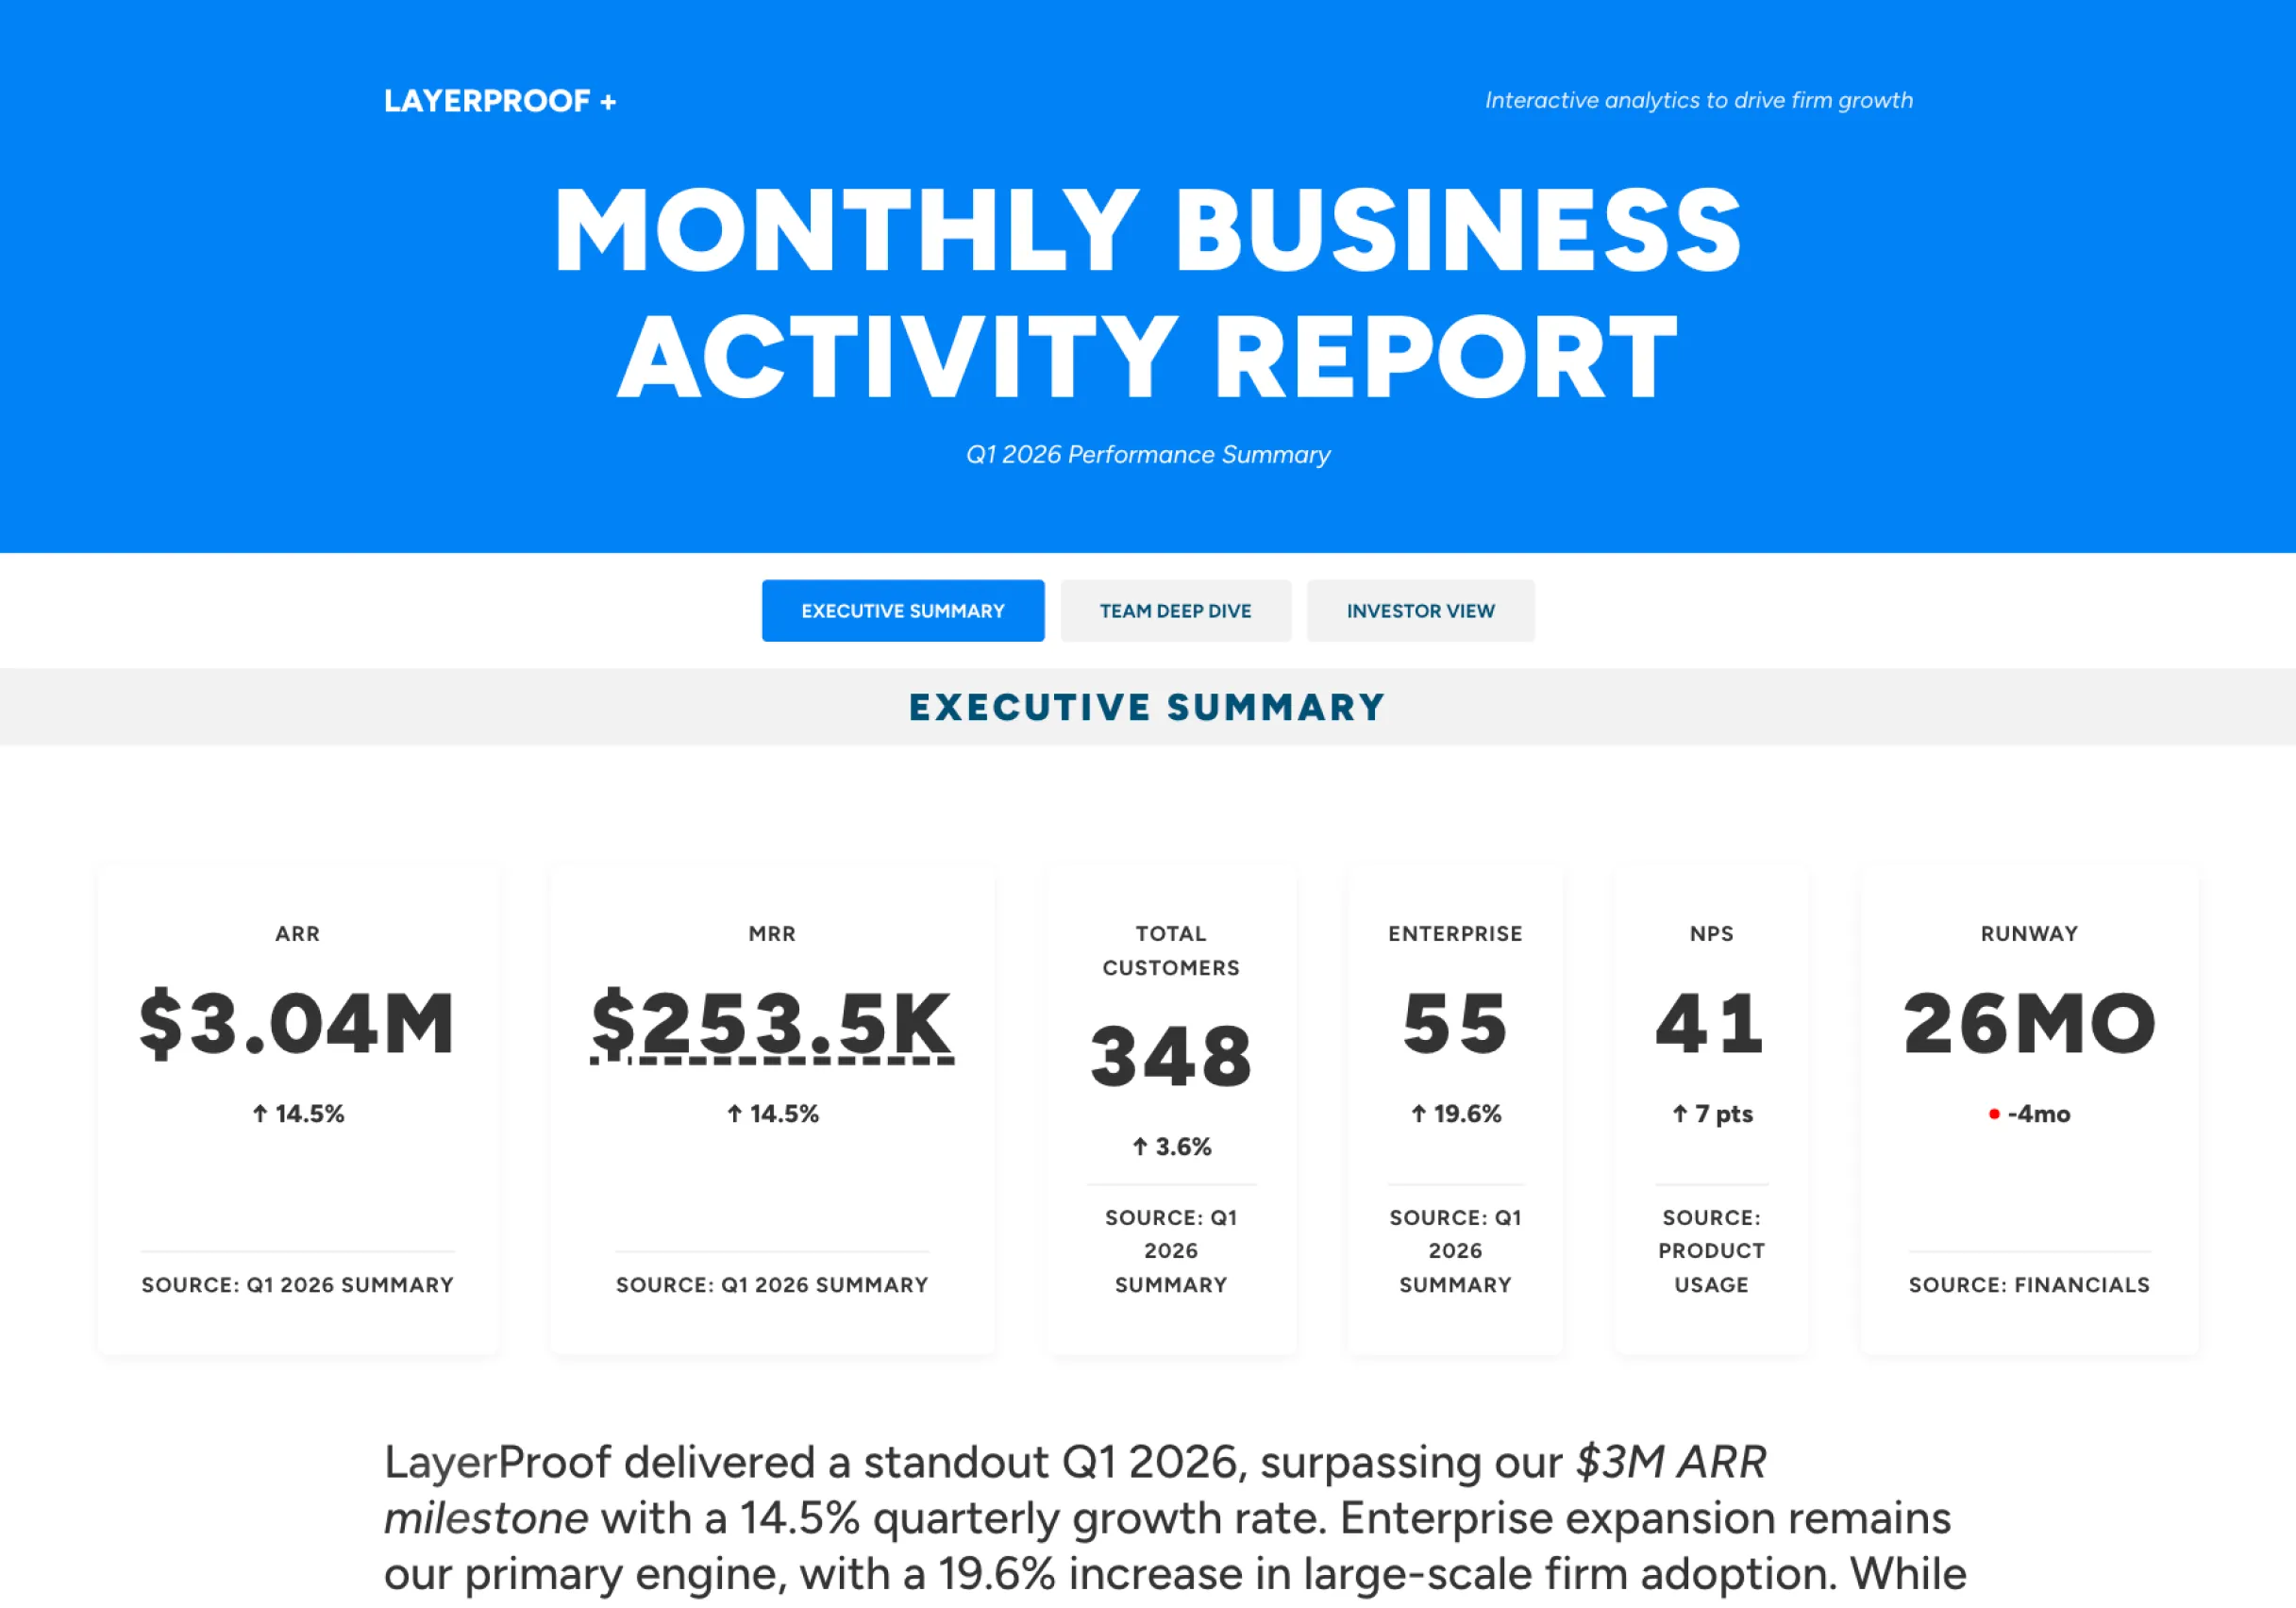
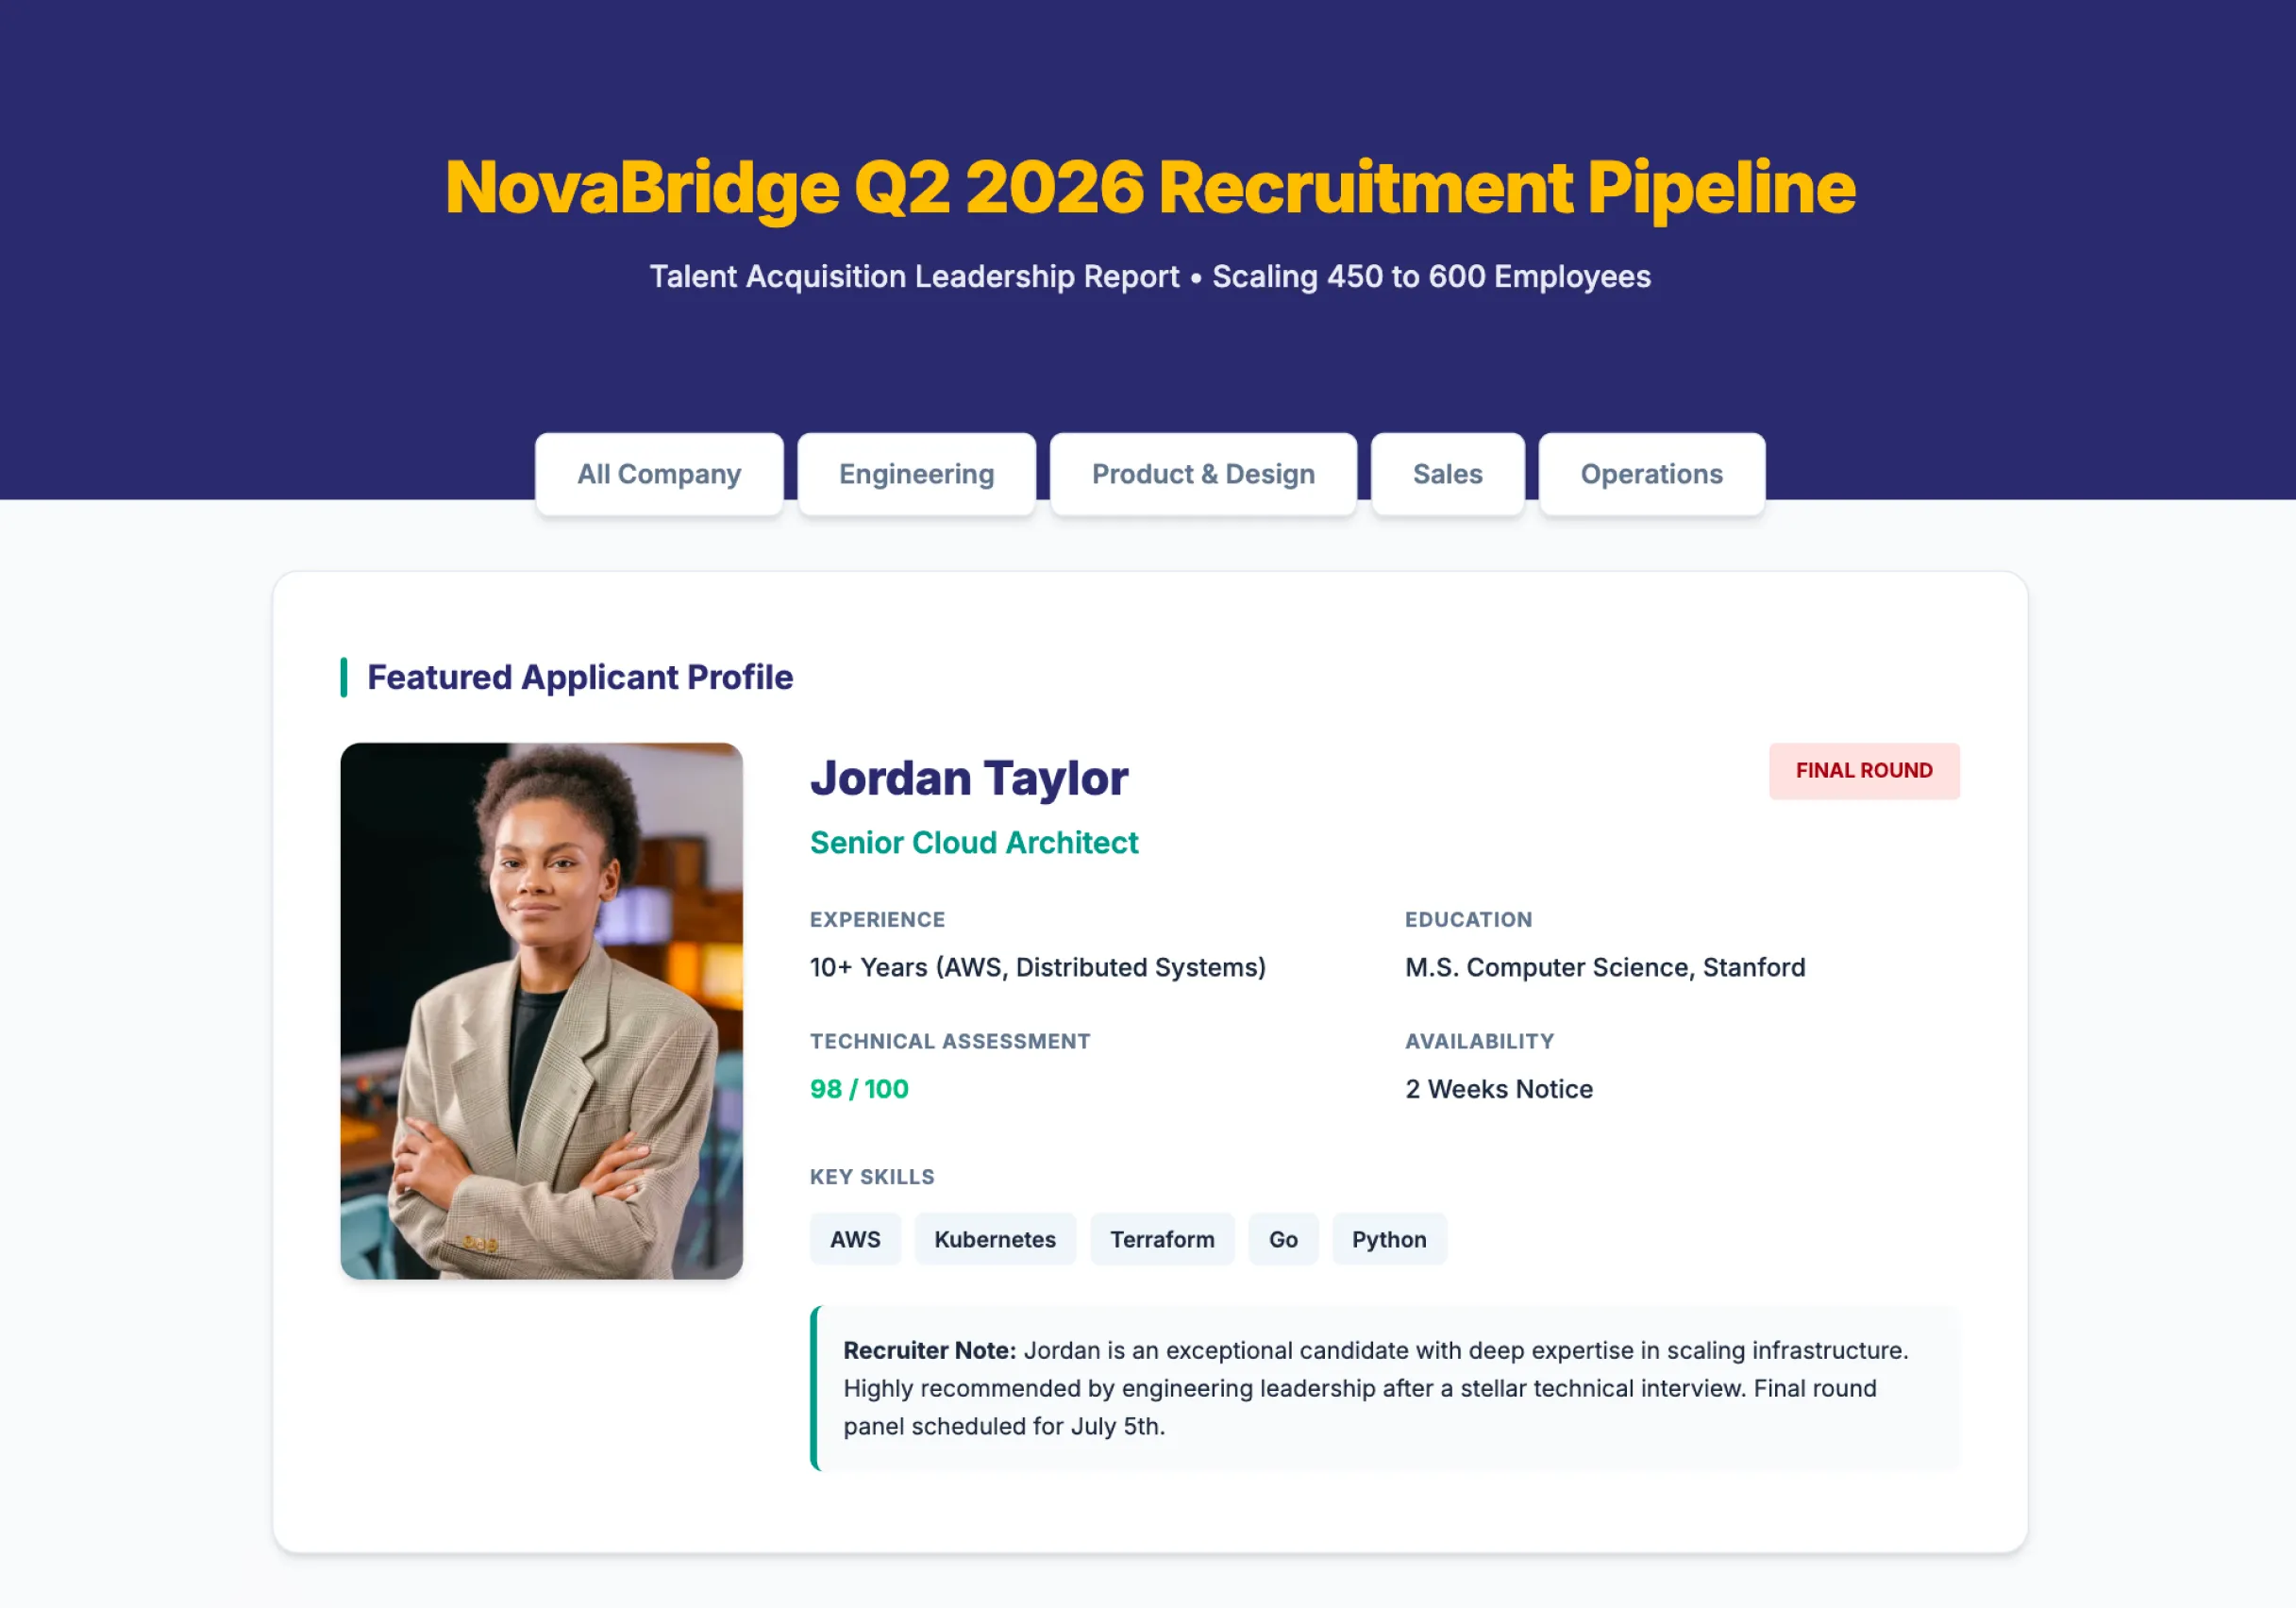
A deep dive into the LayerProof ecosystem. Growth is driven by a small power-user cohort; the priority is bridging the gap between discovery and activation.
Filters, comparisons, interactive timelines, etc. If it's HTML, the agent can add it.
Start now 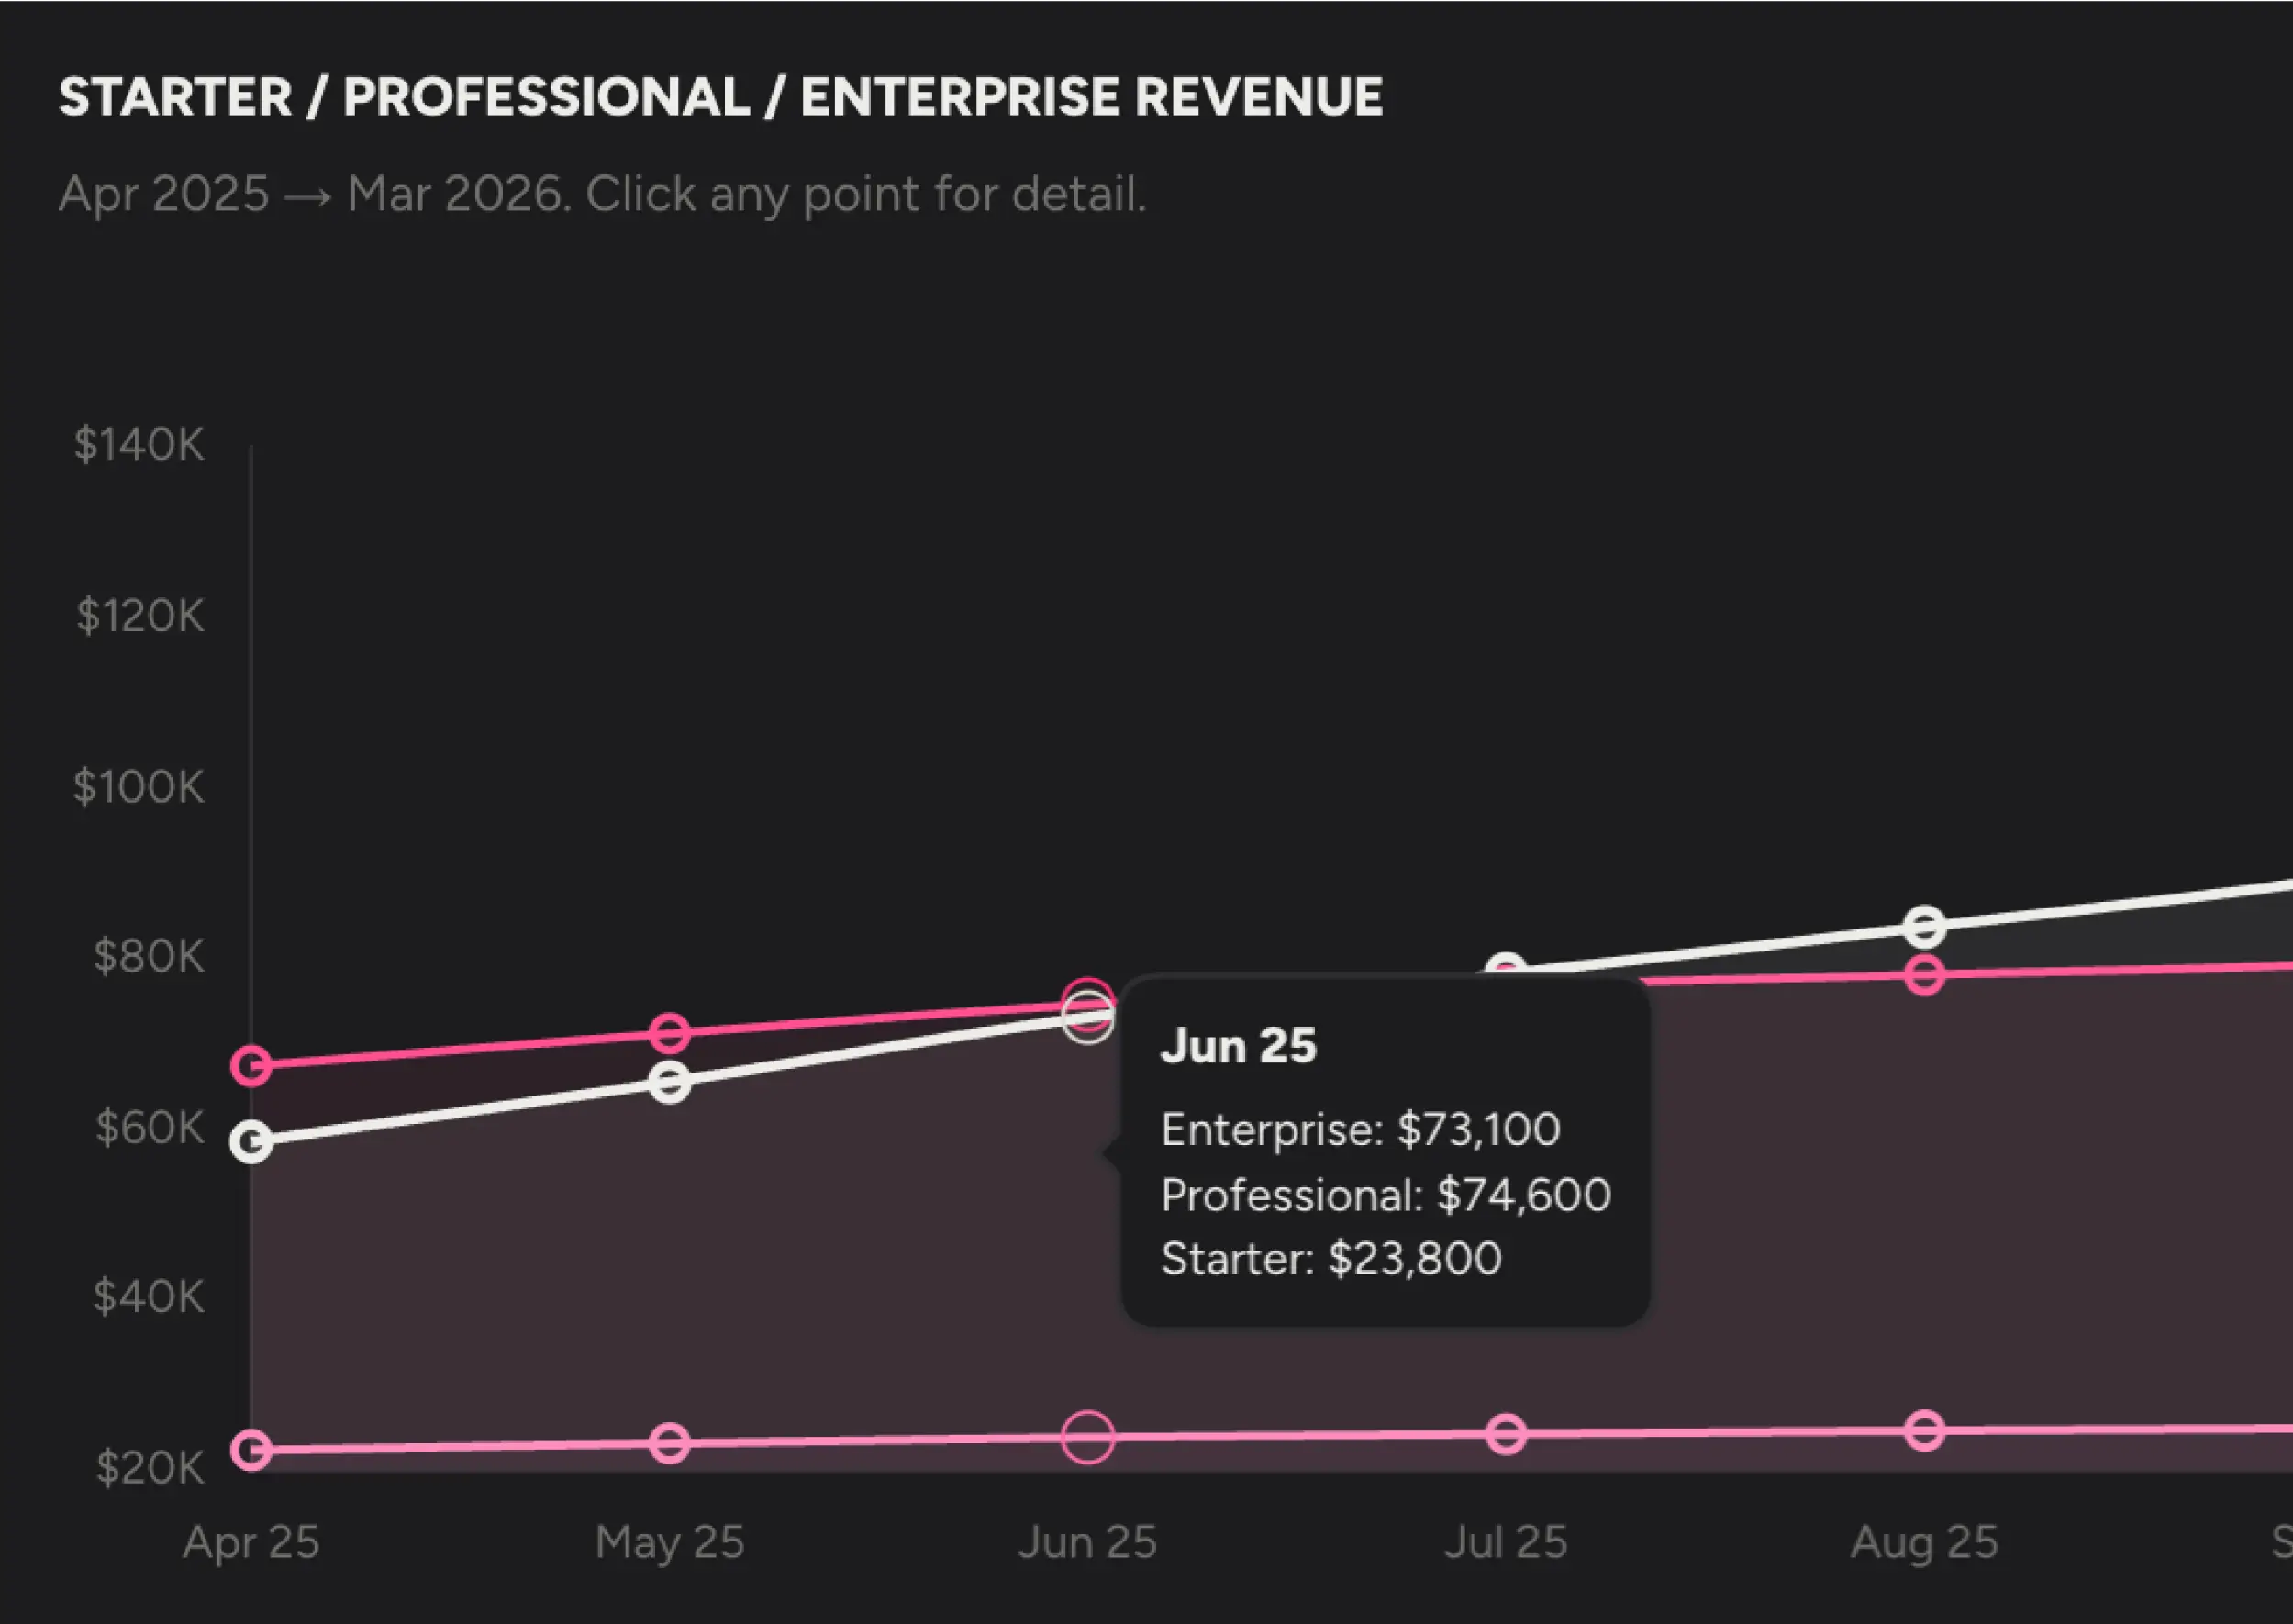
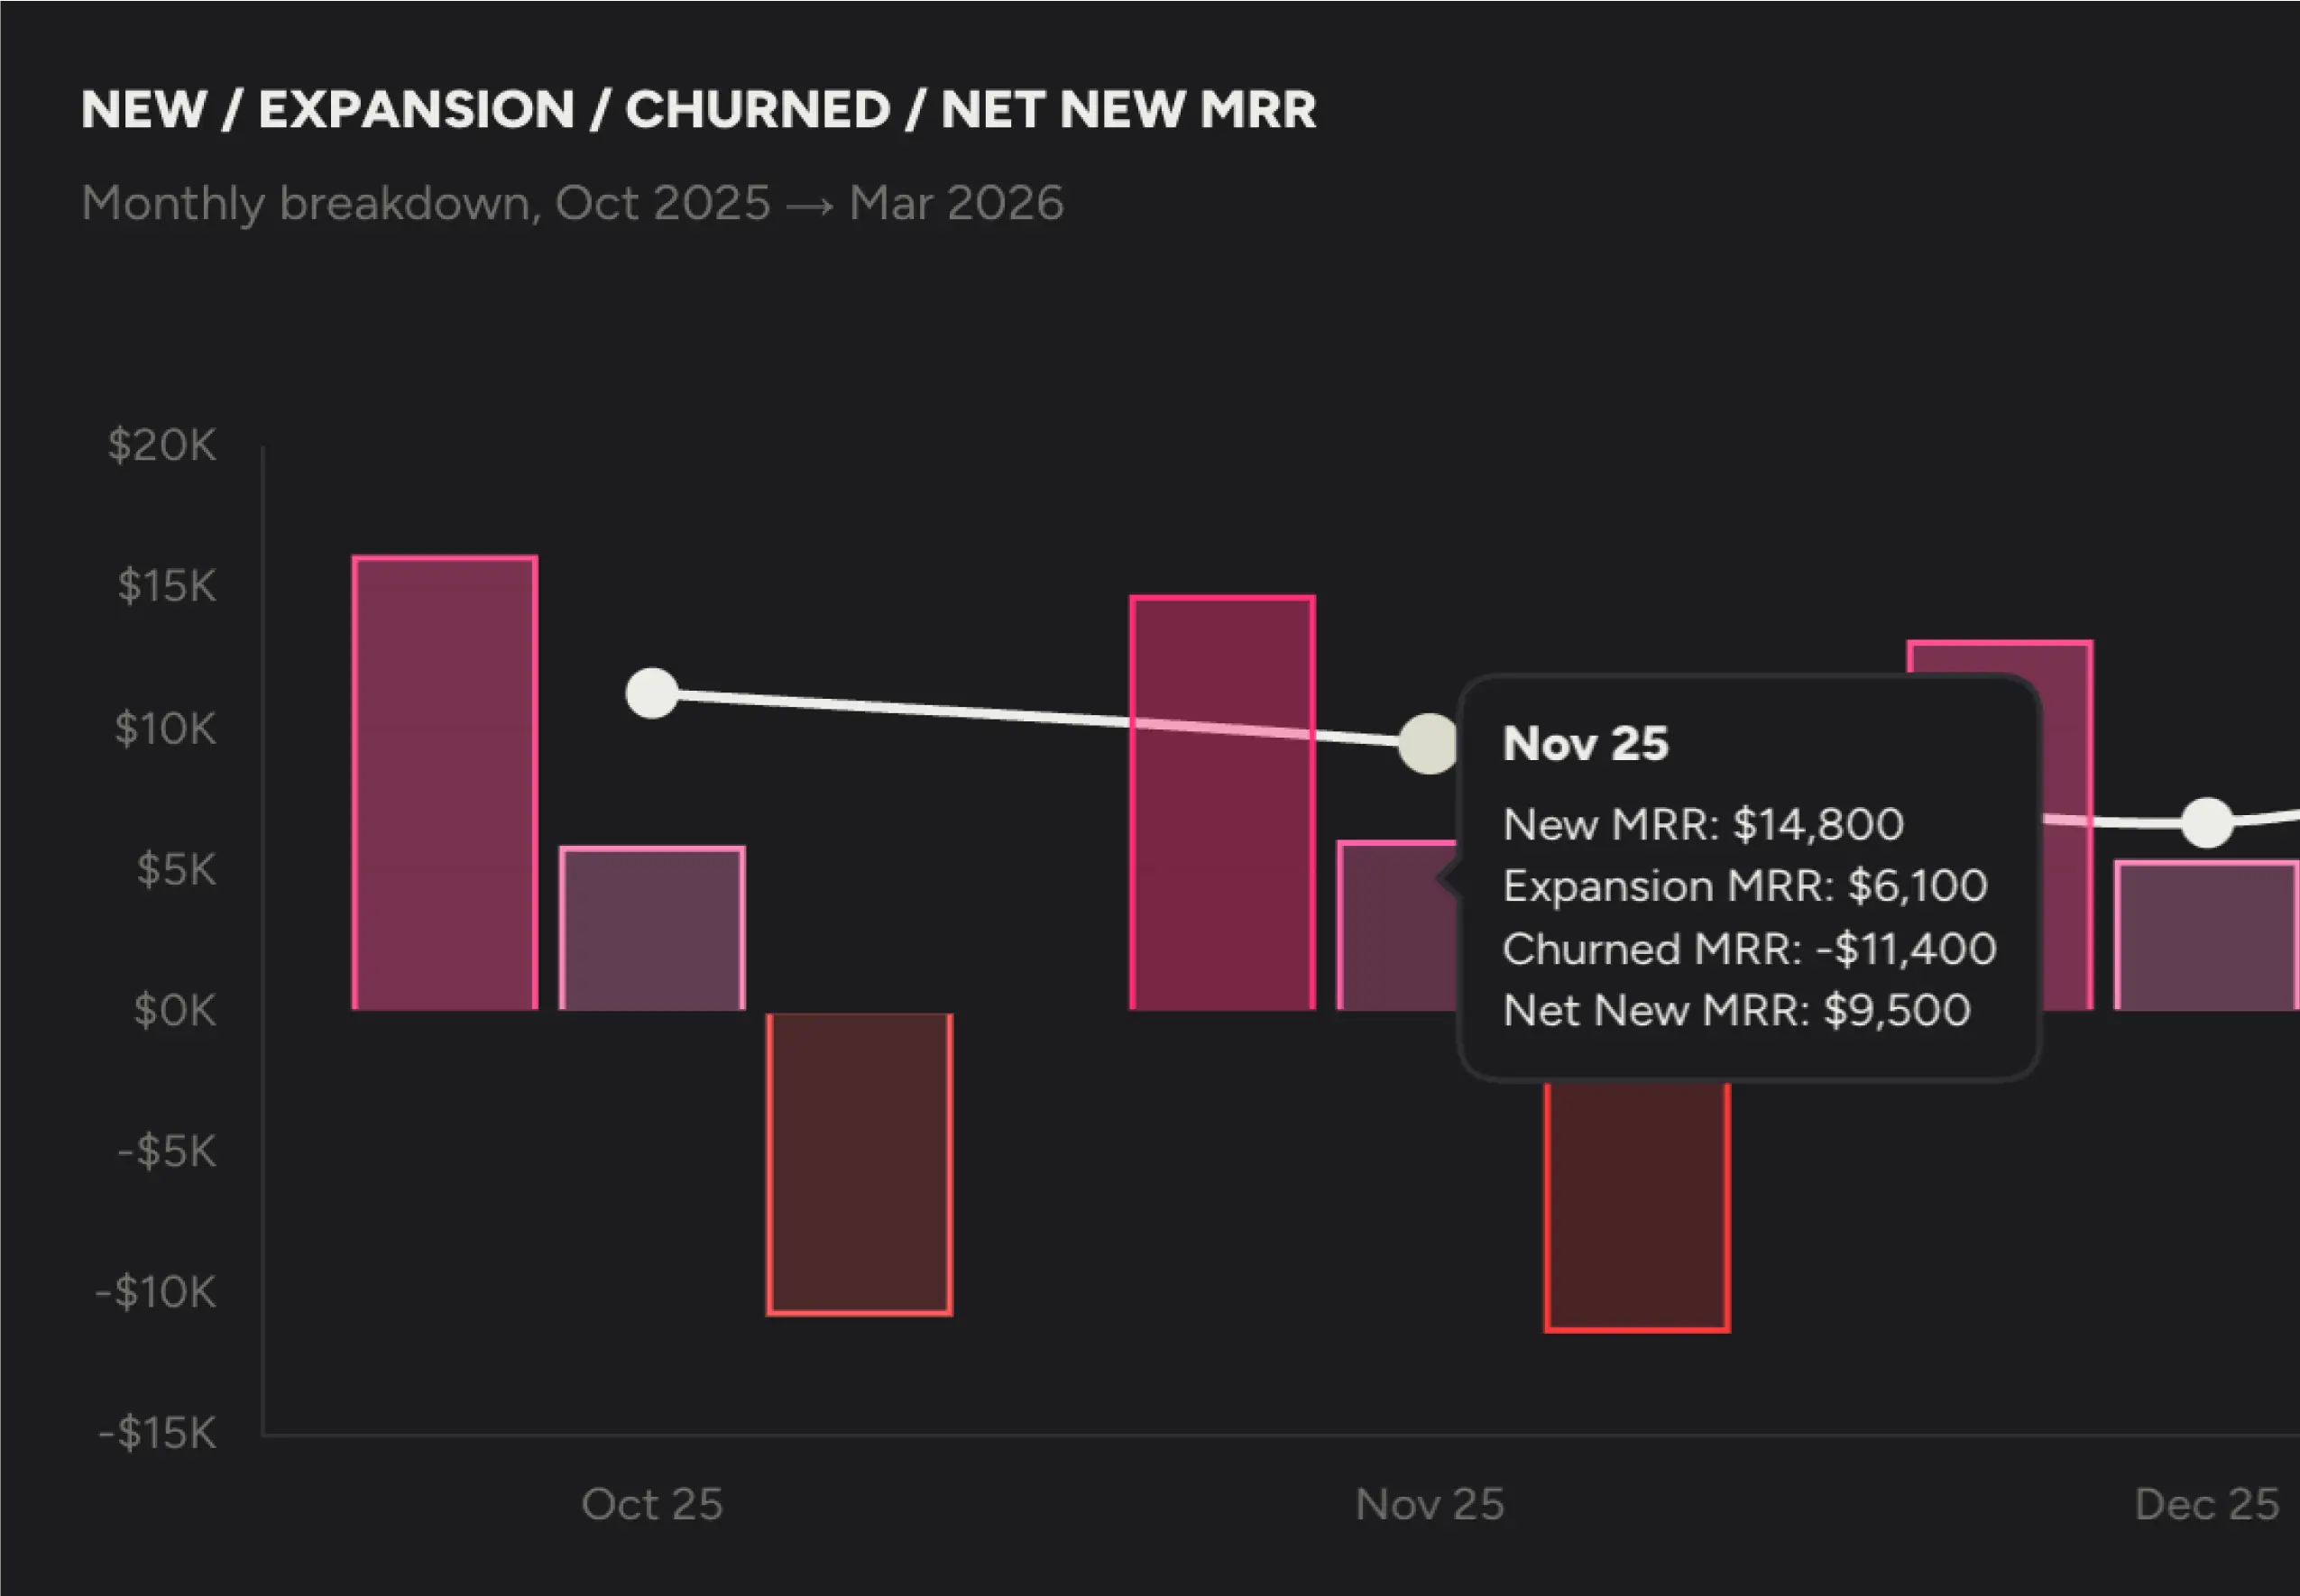
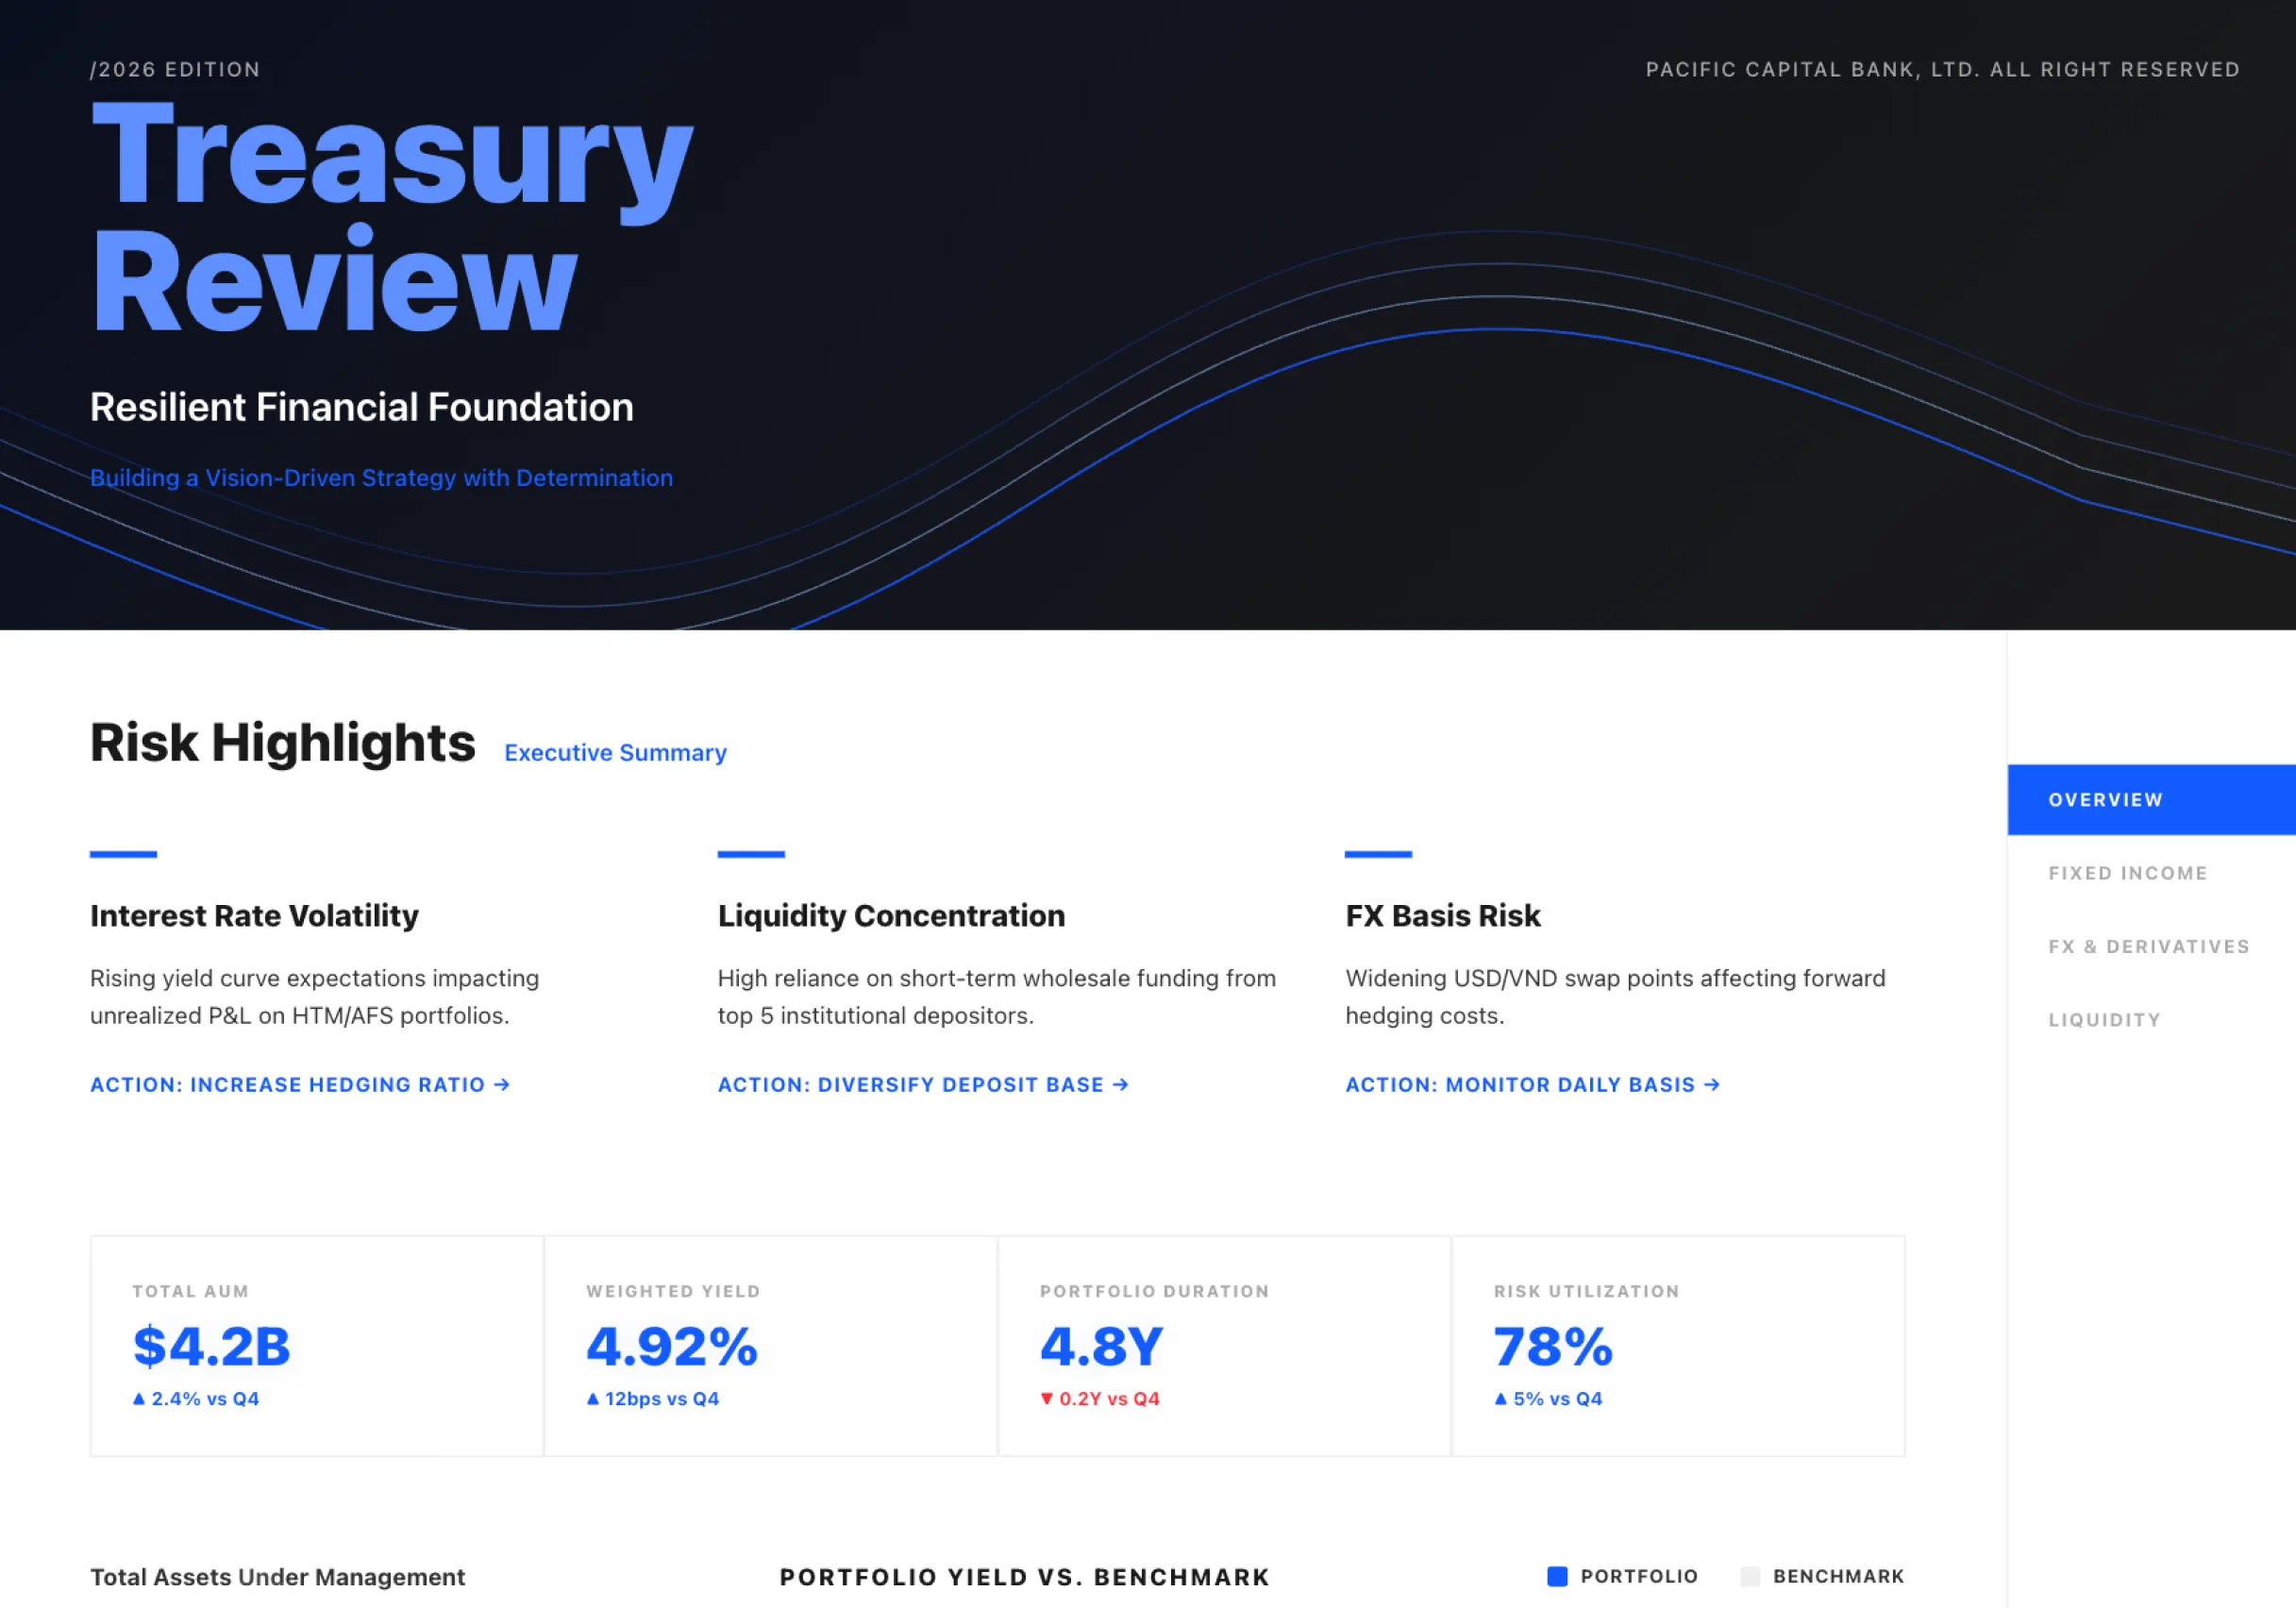
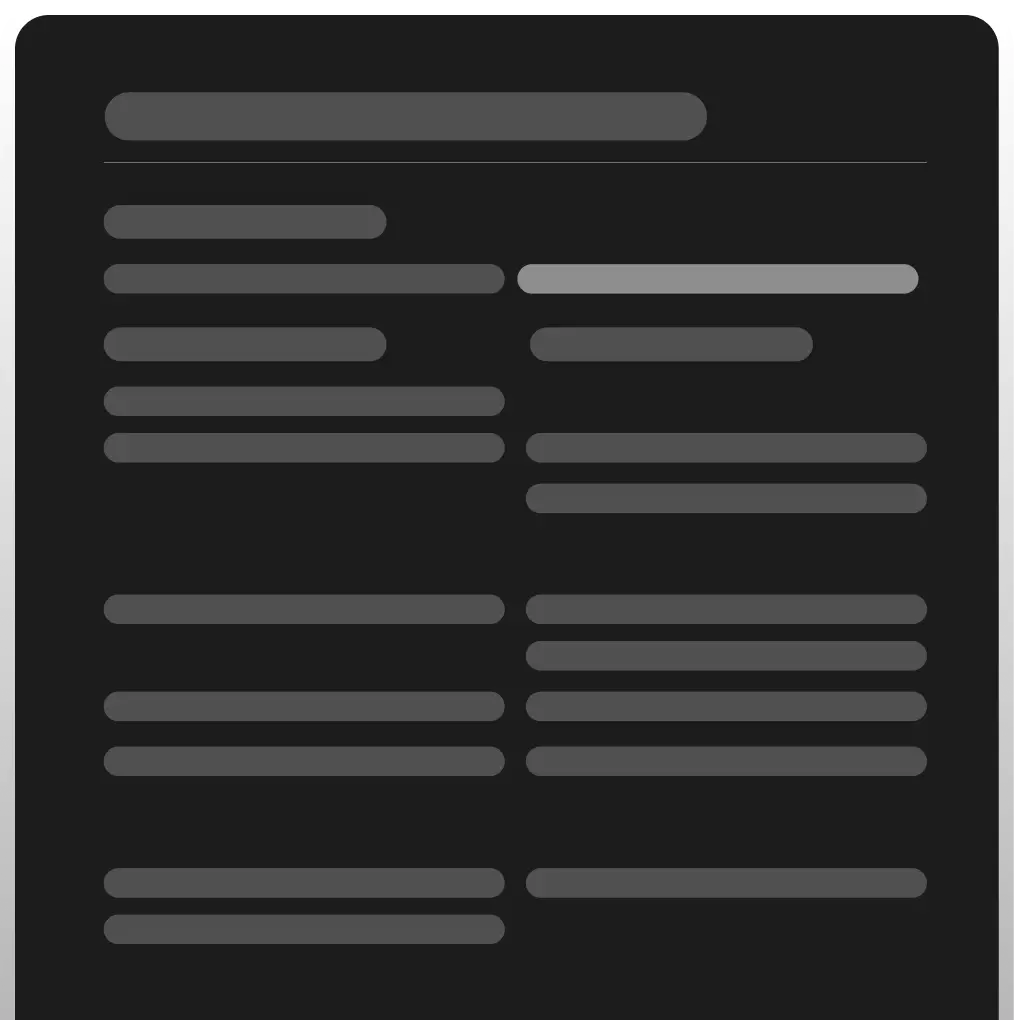
Interactive charts, drillable sections, and traceable numbers make every report easier to trust.
Start now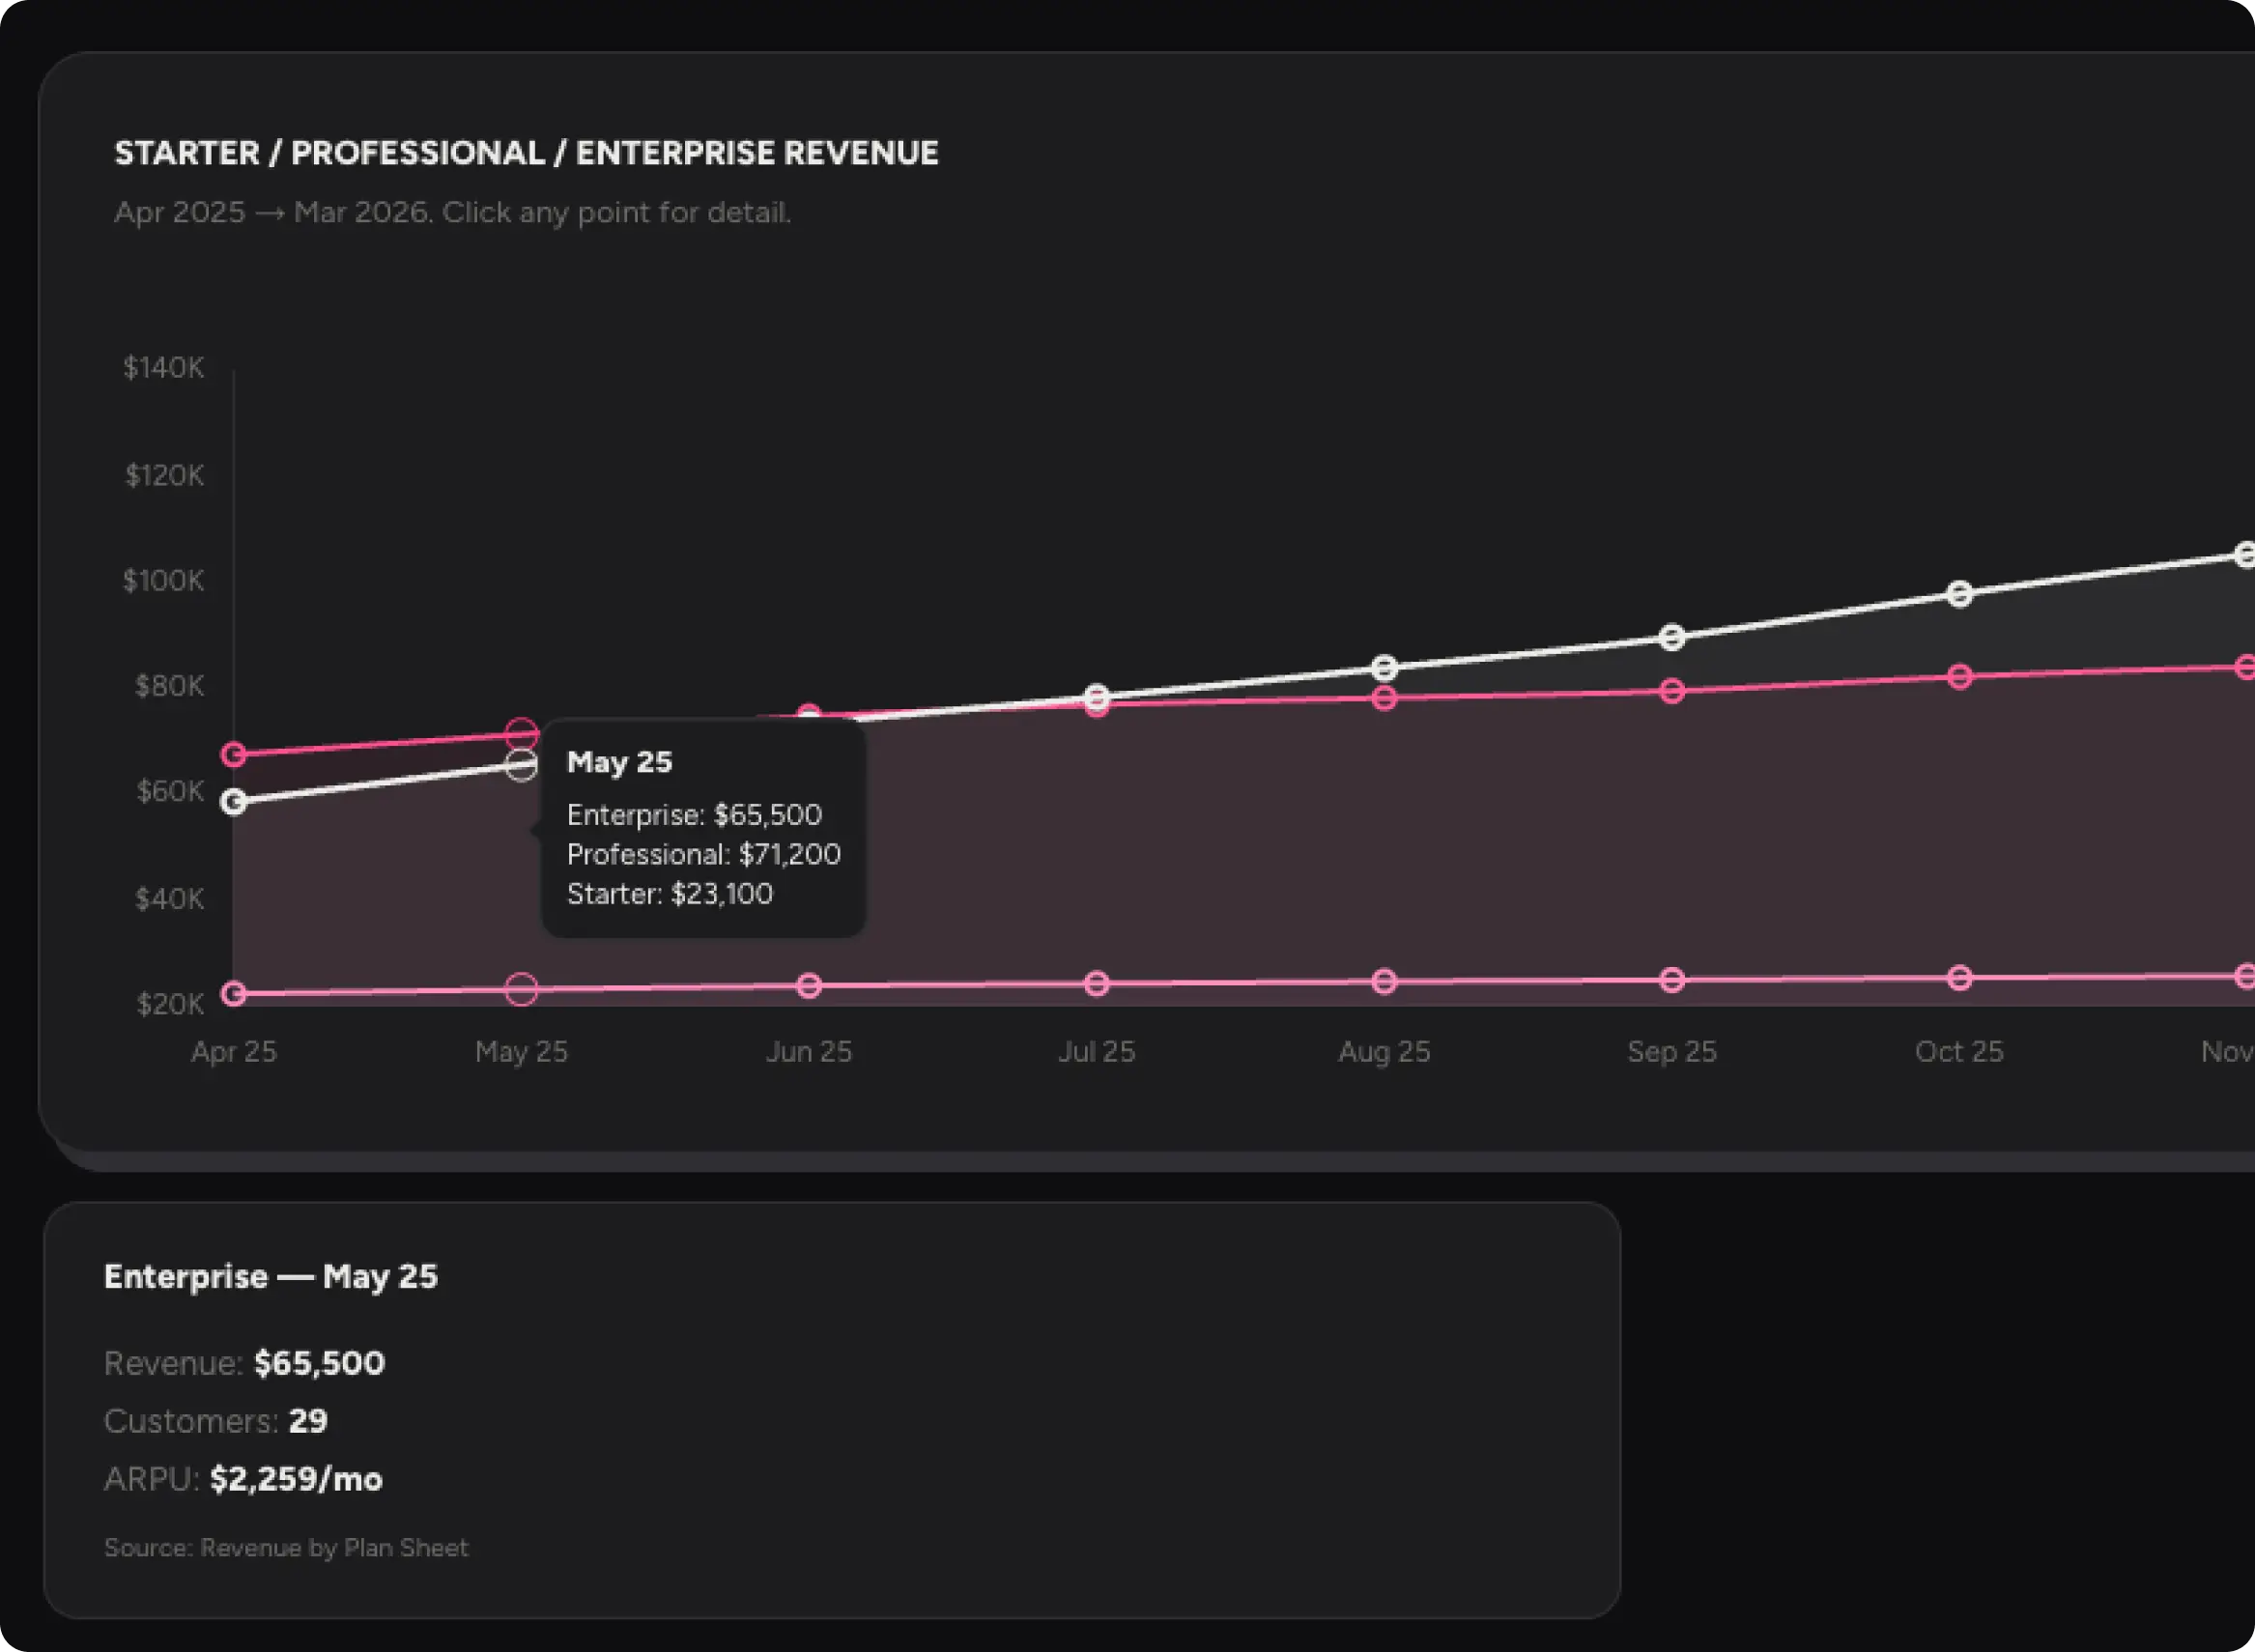
No — Bristol is built for reporting deliverables. Charts are interactive and every number can be traced back to its source, so the output stands up in front of a client or leadership team.
No. Bristol is for business users. It's creation-first: it listens to your data + goal + brand, designs with you in conversation, and produces something that's ready to send — no handoff.
Bristol doesn't win on "integration count" at launch. It wins on output quality: on-brand, interactive, sourced deliverables that feel like your work — not the tool's template.